Download
1 / 16
210 likes | 380 Views
IDENTIFICATION OF COTTON PHENOLOGICAL FEATURES BASED ON THE VEGETATION CONDITION INDEX ( VCI). C. Domenikiotis (1), E. Tsiros (2), M. Spiliotopoulos (2), N.R. Dalezios (1) (1) Department of Agriculture, Animal Production and Aquatic Environment

E N D
IDENTIFICATION OF COTTON PHENOLOGICAL FEATURES BASED ON THE VEGETATION CONDITION INDEX (VCI) C. Domenikiotis (1), E. Tsiros (2), M. Spiliotopoulos (2), N.R. Dalezios (1) (1) Department of Agriculture, Animal Production and Aquatic Environment (2) Management of Rural Environment and Natural Resources University of Thessaly, Greece
OBJECTIVES • use of Vegetation Condition Index for the assessment of cotton phenological features • zoning of cotton productive areas • cotton production assessment for different climatic zones UNIVERSITY OF THESSALY, LABORATORY OF AGROMETEOROLOGY - HYDROMETEOROLOGY
CLIMATIC ZONES OF GREECE UNIVERSITY OF THESSALY, LABORATORY OF AGROMETEOROLOGY - HYDROMETEOROLOGY
Study Area UNIVERSITY OF THESSALY, LABORATORY OF AGROMETEOROLOGY - HYDROMETEOROLOGY
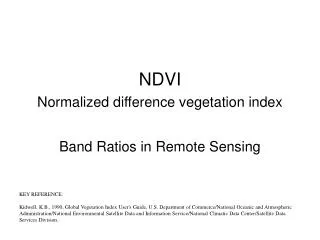
DATA SET Satellite Data • 18 years x 36 NDVI images (1 image per ten-days) Statistical Data for Cotton • Production data were provided by the National Statistical Service of Greece UNIVERSITY OF THESSALY, LABORATORY OF AGROMETEOROLOGY - HYDROMETEOROLOGY
METHODOLOGY • Step 1: Filtering – Maximum Value Composite (MVC): • Composition of daily maps of NDVI • Noise removal: • Maximum Value Composites • Filtering: “4253 compound twice” (Van Dijk,1987) UNIVERSITY OF THESSALY, LABORATORY OF AGROMETEOROLOGY - HYDROMETEOROLOGY
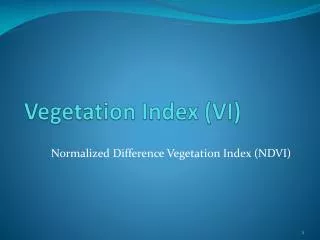
Step 2: Vegetation Condition Index (VCI): • An extension of the NDVI • Based on the concept of ecological potential of an area given by geographical resources such as: • -climate, • -soil variation, • -vegetation type and quantity, and • -topography of the area. • Separates the short-term weather signal to long-term ecological signal • Provides a quantitative estimation of weather impact on vegetation (Kogan,1990) • Values 0<VCI<100 (0 -> unfavorable conditions, 100 -> optimal conditions) Estimated for the period 1981 - 1999 UNIVERSITY OF THESSALY, LABORATORY OF AGROMETEOROLOGY - HYDROMETEOROLOGY
VCI values for Central and Northern Greece UNIVERSITY OF THESSALY, LABORATORY OF AGROMETEOROLOGY - HYDROMETEOROLOGY
Correlation per prefecture between VCI values and cotton production UNIVERSITY OF THESSALY, LABORATORY OF AGROMETEOROLOGY - HYDROMETEOROLOGY
Correlation between VCI values and cotton production UNIVERSITY OF THESSALY, LABORATORY OF AGROMETEOROLOGY - HYDROMETEOROLOGY
Step 3: Cluster Analysis UNIVERSITY OF THESSALY, LABORATORY OF AGROMETEOROLOGY - HYDROMETEOROLOGY
Geographical distribution of the clusters UNIVERSITY OF THESSALY, LABORATORY OF AGROMETEOROLOGY - HYDROMETEOROLOGY
Correlation per cluster between VCI values and cotton production UNIVERSITY OF THESSALY, LABORATORY OF AGROMETEOROLOGY - HYDROMETEOROLOGY
UNIVERSITY OF THESSALY, LABORATORY OF AGROMETEOROLOGY - HYDROMETEOROLOGY
Step 4: Production assessment per cluster Equationsof estimation: Northern Greece: Cotton production(tn) = 16530x - 1E+06 (R2 = 0,75) Central Greece: Cotton production(tn) = 21581x - 888809 (R2 = 0,85) Greece: Cotton production(tn) = 40877x - 2E+06 (R2 = 0,87) UNIVERSITY OF THESSALY, LABORATORY OF AGROMETEOROLOGY - HYDROMETEOROLOGY
CONCLUSIONS • VCI has the advantage to isolate ground from weather depended conditions • at the prefecture level VCI does not provide consistent cotton production assessment • clustering can identify similarities in VCI evolution during the growing season and can be used for zoning areas of cotton production • VCI can be proved a useful tool for monitoring and forecasting the cotton production (when applied to the growing season) at regional level UNIVERSITY OF THESSALY, LABORATORY OF AGROMETEOROLOGY - HYDROMETEOROLOGY