Download
1 / 21
210 likes | 337 Views
Speaker Identification based on the statistical analysis of F0. Pavel Labutin, Sergey Koval, Andrey Raev St. Petersburg, Russia koval@speechpro.com. Report overview. The problem of the F0 usage in forensic speaker identification Main challenges Proposed Method Results Conclusion.

E N D
Speaker Identification based on the statistical analysis of F0 Pavel Labutin, Sergey Koval, Andrey RaevSt. Petersburg, Russia koval@speechpro.com
Report overview • The problem of the F0 usage in forensic speaker identification • Main challenges • Proposed Method • Results • Conclusion
The problem of the F0 usage in forensic speaker identification q F0 analysis - obligatory stage in forensic speaker identification. • Remedial legislation demands: forensic investigation of the speech evidence must be comprehensive • Because pitch reflects important properties of the human voice, consequently it must be investigated by forensic examination of the speech record q Typical F0 usage by speaker identification Automatic F0 detection Some data smoothing Simple F0 statistics comparison
Main challenges in F0 usage for forensic speaker identification q Low speech quality for real police records As usual SNR < 15 dB Frequency range is limited Speech signal distortions (compression, non linear FR of channel equipment, tape recorders etc.) q High inner speaker F0 variability q High dependence F0 statistics from speaker state and style of speech Fig.1. F0 curve for telephone conversation of the suspected person. At 15th sec he got an important information: Average F0 grew in 70Hz. Vertical axis – frequency (Hz), horizontal axis – time (sec),
The method discussed Three stages: • F0 reliable detection 2. F0 detection control an correction 3. F0 statistics data analysis and comparison. F0 Detection algorithm: • two-pass-method; • using summation of multiple harmonics in the spectral field; • Noise cancellation, adaptation for speech signals of very low quality • Good results for field applications; • Is implemented into expert software (SIS) and is used for real forensic examinations. Fig.2. Waveform (upper window) and F0 curve (thin yellow curve) superimposed on cepstrogram (bottom window). On the cepstrogram picture [7] shadow degree corresponds to the signal periodicity degree at this point of frequency and time. Vertical axis – frequency (Hz), horizontal axis – time (sec).
F0 detection exactness control and correction Fig.3. Waveform (upper window)and F0 curve (thin yellow line in bottom window). Correspondence between real F0 and calculated curve is unknown and uncontrolled. Vertical axis – frequency (Hz), horizontal axis – time (sec).
F0 detection exactness control and correction Fig.4. Waveform (upper window), cepstrogram (signal periodicity function – in the middle) and F0 curve (thin yerllow curve) superimposed on cepstrogram (bottom window). On the cepstrogram picture [7] shadow degree corresponds to the signal periodicity degree at this point of frequency and time. Vertical axis – frequency (Hz), horizontal axis – time (sec).
F0 detection exactness control and correction Fig.5. Waveform (upper window), initially detected F0 curve (yellow curve) superimposed on cepstrogram (middle window), graphically corrected by expert’s F0 curve and cepstrogram (bottom window). On the cepstrogram picture [7] shadow degree corresponds to the signal periodicity degree at this point of frequency and time.Vertical axis – frequency (Hz), horizontal axis – time (sec).
Statistical F0 features used Values of pitch are transformed to a logarithmic scale, and then statistical pitch features are calculated. The typical set of the statistical parameters: • Average value, Hz; • Maximum, Hz; • Minimum, Hz; • Maximum -3%, Hz;* • Minimum +1%, Hz; • Median, Hz; • Percent of areas with raising pitch,%;* • Pitch logarithm variation;* • Pitch logarithm distribution asymmetry;* • Pitch logarithm distribution excess; • Average velocity of pitch change, %/sec; • Pitch logarithm variation derivative; • Pitch logarithm derivative distribution asymmetry; • Pitch logarithm derivative distribution excess; • Average velocity of pitch raise, %/sec;* • Average velocity of pitch fall, %/sec.* The asterisk indicates the statistical features more heavily weighted in common metric for speaker identification.
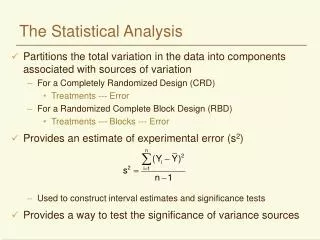
General identification metric • The deviation of every statistical parameter was calculated for every file pair from the corpus. • The distributions of the deviations for pairs “same-different” and “same–same” were built • Functions False Acceptance (FA), False Rejection (FR) and EER (Equal Error Rate) were calculated for every statistical parameter. • The general identification metric was constructed as a weighted sum of separate statistical parameters. • The weights were selected to minimize EER for the given speech database. • For general weighted metric FR and FA curves and ERR were calculated.
Speech data base used for training and testing A speaker identification algorithm was developed and trained using the STC corpus RUSTEN. RUSTEN includes: 126 speakers (67 women and 59 men) in 5 sessions for 5 different analog telephone lines (including public telephones from noisy streets and underground stations), real spontaneous dialogs and 130 speakers (61 women and 69 men) in 2 – 10 sessions for differentdigital telephone lines about 1000 files of high quality digital phone channel conversations. RUSTEN: Russian Switched Telephone Network speech database (STC), 2003. S0050, ELDA - Evaluations and Language resources Distribution Agency.
An example of F0 feature detection in SIS software Fig.6. An example of working window of the SIS software with the results of F0 statistic comparison for two speakers. Such screenshots are typically inserted into the expert examination conclusion to illustrate F0 statistical analysis results.
Pitch of the two files with differebt avaraged value • Fig.7. Cepstrograms of two compared speech files. The same speaker with different style of speech. According to pitch statistical analysis speakers are the same, although average pitch values differs significantly: 154Hz and 135Hz correspondently.
Results of method testing Tables 1 shows the results of the speaker identification using F0 statistics analysis. The test data base includes about 1600 speech files of 256 speakers, real dialogs through public telephone net, both analog and digital channels.
Results of speaker discrimination using only averaged F0 value. Tables 2 shows the results of the speaker identification using only one, usually used F0 feature: average F0 value. The test data base includes about 1600 speech files of 256 speakers, real dialogs through public telephone net, both analog and digital channels.
CONCLUSION • The method based upon the statistical analysis of F0 for forensic speaker identification is described. • The reliability of the method is tested on a large amount of real speech material of telephone conversations. • Described really very good method to detect F0, check and correct detected F) curve for real forensic speech records. • The method is implemented into expert software (SIS) and used in everyday forensic examination practice.
PERSPECTIVES • The same method of the statistical analysis of F0 is used for diagnostics of unknown speaker anthropometric features, such as age, high, weight , etc. Preliminary results are promising. • Except the statistical F0 analysis we propose for experts in addition to perform detailed structural analysis of the F0 curve. In particular, to measure Max, Min, Range,Timing of the F0 moving for the space of accented syllable of the phrase or for voiced hesitation pauses.