Download
1 / 14
140 likes | 390 Views
Measuring Biotic components of the ecosystem. Objectives To identify what aspects of the biota of an environment we can measure To look at strategies for identifying organisms To look at methods of sampling To look at methods of estimation. What do we measure?.

E N D
Measuring Biotic components of the ecosystem • Objectives • To identify what aspects of the biota of an environment we can measure • To look at strategies for identifying organisms • To look at methods of sampling • To look at methods of estimation
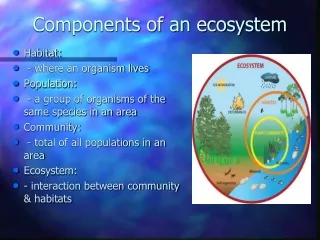
What do we measure? • What things do we want to know about the biota (flora and fauna) of an ecosystem • Biodiversity – species present (may vary with time of year for example) • Biomass – how much living material is present • Species number • Population size • Species assemblages • Representatives of different trophic levels • Relative abundance of species
No.1 Identification • How do we identify organisms? • We use identification keys • These are based on taxonomic relationships • They use features for identification
Sampling • Qualitative – to see what is there • Quantitative – to see how much of something is there
Abundance • Plants and sedentary animals are easy • Use a quadrat
Quadrats • Can be used to assess • % cover • Population density • % frequency • May be spread randomly • May be laid in transects
Mobile species • Sample whole habitat / very difficult • Capture – recapture methods – the larger the population – the fewer will be recaptured. • Gives an estimate of abundance • Lincoln Index • n1 = number of animals first marked and released.n2 = number of animals captured in the second samplem2 = number of marked animals in the second sampleN = Total Population then m2/n2 = n1/N • Or N = n1 x n2 / m2
Problems • How do you capture and mark organisms so that you do not harm them • So you do not prejudice their survival • And render the estimate useless • Much easier with some species than others.
Trophic levels • We may want to measure biomass in each trophic level. • 1. Separate organisms into trophic levels • 2. Dry (weight of water is not relevant and may confuse) • 3. Weight • Obviously requires the death of organisms so we cannot do this! • Dry weight from quantitative samples can be used to extrapolate to ecosystems
Diversity • May mean number of species present: Richness • May be equality of numbers of species: 20% of each of five species as opposed to 90% of one species with the other four species only present occasionally: Evenness • Diversity often calculated as a function of both
Diversity indices • Simpson’s diversity index • used to quantify the biodiversity of a habitat. • It takes into account the number of species present, as well as the abundance of each species. • Richness – number of species per sample • Evenness - Evenness is a measure of the relative abundance of the different species making up the richness of an area.
Simpson’s diversity index • Simpson's Index (D) measures the probability that two individuals randomly selected from a sample will belong to the same species (or some category other than species). There are two versions of the formula for calculating D. Either is acceptable, but be consistent. • D =(n / N)2 or D=N(N-1)/∑n(n-1) • n = the total number of organisms of a particular speciesN = the total number of organisms of all species • The value of D ranges between 0 and 1 where 0 is infinitely diverse and 1 is a monoculture
Health warning • Simpsons Index of Diversity 1-D • Some people don’t like that 0 is diverse so they subtract the value for D from 1 • Then 1= diverse • 0 = monoculture • AlternativelySimpson's Reciprocal Index 1 / D • The value of this index starts with 1 as the lowest possible figure. This figure would represent a community containing only one species. The higher the value, the greater the diversity. The maximum value is the number of species (or other category being used) in the sample. For example if there are five species in the sample, then the maximum value is 5.
Meaning of diversity • A diverse habitat will tend to be biodiverse i.e. rich and indicates a stable undamaged ecosystem. • Note conversely some ecosystems are richer and more biodiverse due to low levels of human interference, e.g. stock grazing • Low diversity indicates pollution, habitat destruction or other aspects of high level human interference or naturally high levels of environmental stress. • Some habitats are naturally less biodiverse than others