Download
1 / 11
110 likes | 236 Views
INFFER (Investment Framework For Environmental Resources) Benefit: Cost Index. Benefit: Cost Index. Used to assess the value for money from projects The Project Assessment Form collects the required information in the required form to calculate the BCI

E N D
INFFER (Investment Framework For Environmental Resources)Benefit: Cost Index
Benefit: Cost Index • Used to assess the value for money from projects • The Project Assessment Form collects the required information in the required form to calculate the BCI • Similar to a Benefit: Cost Ratio in Benefit: Cost Analysis
The BCI An index of benefits from the project Total costs (project and ongoing) • Difference from Benefit: Cost Ratio is that in INFFER we don’t express intangible benefits in $
The formula • Why multiply, not add? • Starting with V as the asset value, W is multiplied because of the way it is defined as the proportional increase in value, A is multiplied because it is defined as a proportion of the required adoption, F, B, P and G are multiplied because they are probabilities, and DFB(L) is multiplied because it is a proportional discount factor.
Why not a weighted additive index? • Big problems with weighted additive systems • Relative scores generally do not reflect relative benefits between projects • A low score in one critical variable can be compensated for by high scores in others • A project with no outcomes could be scored highly • BCI avoids these problems • See FAQ 602 for details and examples
Cost of using a bad metric • Commonly used metrics for project ranking • Add when should multiply variables • Fail to divide by project costs (e.g. subtract costs, or just leave it out!) • Omit key variables (common to ignore adoption and technical feasibility) • All three • Cost of poor metrics is huge • Benefits of investment roughly halved • i.e. could easily double environmental benefits
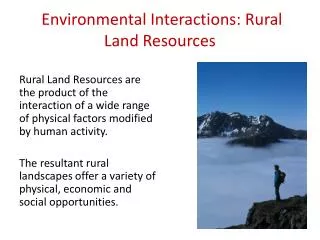
Flexible • Can compare large and small projects • Can compare short and long projects • Allows comparison of projects for different types of assets • Waterways • Wetlands • Vegetation • Threatened species • Agricultural land
Example BCI ranking If budget = $17m, preferred projects are 4, 2 & 5
Role in decision making • The BCI should not be applied mechanistically • It is an important piece of information, but other considerations also matter • Also in the Project Assessment Report are • Risks • Time lag • Spin-offs • Information quality • Information gaps
Acknowledgements • Affiliations of the INFFER team • University of Western Australia • Department of Primary Industries, Victoria • North Central Catchment Management Authority • Future Farm Industries CRC • Other key funders • Australian Research Council (Federation Fellow Program) • Department of the Environment, Water, Heritage and the Arts (CERF Program) • Department of Sustainability and Environment , Victoria