Download
1 / 71
750 likes | 1.5k Views
Cost Benefit Analysis. Cost-Benefit Analysis - 1.

E N D
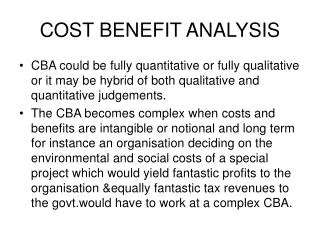
Cost-Benefit Analysis - 1 In cost-benefit analysis, we compare the costs and benefits of one or more projects to determine which are worthwhile, and which should be prioritized when there are multiple projects. The computations are similar to those in cost effectiveness analysis; we simply are applying economic evaluation techniques to two entities: costs and benefits. The minimum requirement for a project to be judged worthwhile is that its benefit-cost ratio be at least 1.0. This means that the benefits equal or exceed the costs of the project. When comparing multiple worthwhile projects, priority would be given to the project with the highest benefit-cost ratio. Cost-benefit analysis can be much more complex that we will present here. Real work problems frequently have benefits to multiple groups, i.e. the recipients of the service and society at large. For example, a person cured of substance abuse could show his or her wages as a personal benefit. Society would also gain because this individual now pays taxes, does not steal to pay for the drug habit, etc. Cost Benefit Analysis, Slide 2 Copyright © 2004, Jim Schwab, University of Texas at Austin
Cost-Benefit Analysis - 2 In many cases, benefits to one group may be costs to another group. For example, welfare reform may save the government money, but reduce the income of merchants who own the stores where welfare recipients shop. Another complexity which we will not pursue is the probability or likelihood of the occurrence of different events or outcomes. Future events and costs are based on the assumption of their likelihood of occurrence. We can calculate scenarios with different probabilities for future events to see what impact that would make for choosing among the available alternatives. Cost Benefit Analysis, Slide 3 Copyright © 2004, Jim Schwab, University of Texas at Austin
Example 1: East Stockton Urban Renewal Project - 1 This problem is similar to the problem in Quantitative Methods for Public Decision Making by Christopher K. McKenna, page 157-159. The objective and social benefits of urban renewal are (1) superior pattern of resource allocation, (2) social benefits of the removal of blight, and (3) improved local financial position. Although there may be a number of alternative uses for land being redeveloped, we are here considering the more aggregate alternatives, either urban renewal or no urban renewal in a particular section of the city. This is the level of evaluation appropriate for cost-benefit analysis. The alternatives would then be the particular urban renewal projects that should or should not be undertaken. Among the constraints active on urban renewal is the legal requirement that a redevelopment agency must provide former residents of an urban renewal area with decent, safe, and sanitary housing that is conveniently located and within the means of the residents. Note that it is not implicitly assumed that relocation results in housing facility improvement for the residents, Cost Benefit Analysis, Slide 4 Copyright © 2004, Jim Schwab, University of Texas at Austin
Example 1: East Stockton Urban Renewal Project - 2 The costs include those for relocation, survey and planning, administration, public improvements, demolition, and the value of improvements demolished. Benefits include those specifically associated with the stated objectives as well as non-economic negative effects of relocation and possible land value write-down. In urban renewal there are, of course, tangible and intangible benefits; in this exercise, our goal is to determine what level of intangible benefits would decision makers have to substantiate in order to justify the project from a cost-benefit perspective. The East Stockton, California, Urban Renewal Project was officially approved by the federal government in July 1959. The workbook, “UrbanRenewal.xls”, which can be downloaded from the course download web page, displays the various costs associated with the renewal project and the time at which they occurred. Most of the costs were actually incurred over an interval of time; in such cases the center of the interval is used as the date of the cost. Cost Benefit Analysis, Slide 5 Copyright © 2004, Jim Schwab, University of Texas at Austin
Example 1: East Stockton Urban Renewal Project - 3 The cost of the land is not included in the list of costs since land purchases were later resold. In the East Stockton renewal project, the land was purchased for $669,129 over a period roughly centered at June 30, 1960. After clearing and renewal, the land was subsequently sold for $1,200,000 over a period roughly centered at June 30, 1965. Employing a discount rate of 6 percent, the selling price was discounted to June 30, 1960, yielding a present value of $896,760; hence, the redevelopment agency had a “profit” of $227,631 on the project area land. This amount is included in the list of tangible benefits in the “UrbanRenewal” workbook. Other tangible benefits were not quite so easily estimated. The increase in the property value in the project area was the result of three factors: inflation, growth in real income and population, and urban renewal. To isolate the increase due to urban renewal, a comparison was made between increases in the project area and increases near the project area. The comparison led to an estimate of $415,500 as the increase in the value of the neighborhood properties. Public improvements such as schools and parts were estimated at a value equal to their cost. Cost Benefit Analysis, Slide 6 Copyright © 2004, Jim Schwab, University of Texas at Austin
Example 1: East Stockton Urban Renewal Project - 4 Urban renewal is generally expected to reduce the cost of municipal services. The savings in the cost of fire protection was estimated by noting that prior to urban renewal the per person expenditure for East Stockton as was 2½ times what it was for the rest of the city. Assuming that after renewal the residents of East Stockton would require only average protection, the reduced cost of fire protection was estimated to be $42,000 annually. Capitalizing the annual amount of $42,000 at 6 percent yields $700,000 as the present value of future fire protection cost savings. The savings in health protection and police protection costs were estimated similarly. The questions we will answer in this exercise are: what level of intangible benefits need to be identified in order for this project to satisfy the minimum cost benefit ratio of 1.0? Does a higher or lower discount rate substantially change our answer? Cost Benefit Analysis, Slide 7 Copyright © 2004, Jim Schwab, University of Texas at Austin
Tangible costs/benefits of urban renewal project The tangible costs and benefits for the project have been entered in a workbook called UrbanRenewal.xls which can be downloaded from a course web page. All of this information is given in the chapter by McKenna. Note that the worksheet includes the Date of the expense because not all expenses occurred at regular annual intervals. Excel has another worksheet function to support calculations of net present value when the stream of payments occur in different time periods, the XNPV function. Cost Benefit Analysis, Slide 8 Copyright © 2004, Jim Schwab, University of Texas at Austin
The discount rate First, we enter the discount rate stated in the problem 6% in the cell D2 of the Cost-benefit analysis worksheet. Cost Benefit Analysis, Slide 9 Copyright © 2004, Jim Schwab, University of Texas at Austin
Use XNPV function to calculate value of tangible costs First, select the cell in which we Excel to return the present value of the tangible costs, cell B14 on the Cost-benefit analysis worksheet. Second, select the Function command from the Insert menu. Unlike the ‘NPV’ function, the ‘XNPV’ function does not make the assumption that the series of costs occurs at regular, annual intervals. XPNV permits us to associated dates with each cost item. Cost Benefit Analysis, Slide 10 Copyright © 2004, Jim Schwab, University of Texas at Austin
Locate the XNPV function We will search for the XNPV function. First, type XNPV in the Search for text box, and click on the Go button. The XNPV function name will appear in the Select a function list box. Click on the OK button access the dialog box where the function arguments are entered. Note: the XNPV function is part of the Analysis Toolpak that we used for Data Analysis. If Excel does not find it, check to make sure the Analysis Toolpak Add-in has been installed. Cost Benefit Analysis, Slide 11 Copyright © 2004, Jim Schwab, University of Texas at Austin
The arguments to the XNPV function The first argument to the XNPV function is the discount rate, which we put in cell D2. The second argument to the XNPV function is the cells containing the tangible costs, B2:B12. The third argument to the XNPV function is the cells containing the dates the tangible costs occurred, C2:C12. With the arguments entered, click on the OK button. Cost Benefit Analysis, Slide 12 Copyright © 2004, Jim Schwab, University of Texas at Austin
Net present value of tangible costs Excel computes the net present value for the series of costs for this project. Cost Benefit Analysis, Slide 13 Copyright © 2004, Jim Schwab, University of Texas at Austin
The table of tangible benefits - 1 The XPNV function discounts the stream of costs or benefits back to the first date in the series. For costs, the entry for ‘Survey and planning’ was dated to occur at the start of the project. Since this item was listed first, it could be used for the date (12-31-58) to which all other costs were discounted. Cost Benefit Analysis, Slide 14 Copyright © 2004, Jim Schwab, University of Texas at Austin
The table of tangible benefits - 2 The table of tangible benefits was copied from the McKenna text, except for the entry on row 18 which was added as a requirement of the XNPV function. In the case of benefits, there was, quite naturally, no benefit to be realized at the start of the project. To satisfy the Excel XPNV function, I added a dummy entry to the table, ‘Immediate benefits’ with a value of $0 to be realized at the start of the project on 12-31-58. Since this entry was for zero dollars, it will not affect our benefit calculations. The date entry in cell C18 meets the requirement of the XNPV function for an initial date to which all other benefits are discounted. Cost Benefit Analysis, Slide 15 Copyright © 2004, Jim Schwab, University of Texas at Austin
Use XNPV to calculate value of tangible benefits First, select the cell in which we Excel to return the present value of the tangible benefits cell B26 on the Cost-benefit analysis worksheet. Second, select the Function command from the Insert menu. Cost Benefit Analysis, Slide 16 Copyright © 2004, Jim Schwab, University of Texas at Austin
Locate the XNPV function We will search for the XNPV function. First, type XNPV in the Search for text box, and click on the Go button. The XNPV function name will appear in the Select a function list box. Click on the OK button access the dialog box where the function arguments are entered. Note: the XNPV function is part of the Analysis Toolpak that we used for Data Analysis. If Excel does not find it, check to make sure the Analysis Toolpak Add-in has been installed. Cost Benefit Analysis, Slide 17 Copyright © 2004, Jim Schwab, University of Texas at Austin
The arguments to the XNPV function The first argument to the XNPV function is the discount rate, which we put in cell D2. The second argument to the XNPV function is the cells containing the tangible benefits, B18:B24. The third argument to the XNPV function is the cells containing the dates the tangible benefits occurred, C18:C24. With the arguments entered, click on the OK button. Cost Benefit Analysis, Slide 18 Copyright © 2004, Jim Schwab, University of Texas at Austin
Net present value of tangible benefits Excel computes the net present value for the series of benefits for this project. Cost Benefit Analysis, Slide 19 Copyright © 2004, Jim Schwab, University of Texas at Austin
Compute the required intangible benefits The problem statement wanted us to find the minimum level of intangible benefits that would be necessary to meet the minimum benefit-cost ratio of 1.0. The ‘Required intangible benefits’ are equal to the difference between tangible costs and tangible benefits. In cell B28, enter the formula for computing the difference between tangible costs in cell B14 and tangible benefits in cell B26: =B14-B26. In order to satisfy benefit-cost criteria, the project planners would have to identify and document $1,062,932 in intangible benefits. Cost Benefit Analysis, Slide 20 Copyright © 2004, Jim Schwab, University of Texas at Austin
What if the discount rate were different The problem statement also wanted us to determine whether or not a higher or lower discount rate substantially changes our answer. In order to see the results of the testing different discount rates, we split the screen at row 24 and arrange the panes as shown. Cost Benefit Analysis, Slide 21 Copyright © 2004, Jim Schwab, University of Texas at Austin
Test a higher discount rate Enter 7% in cell D2 to test the effect of a higher discount rate. Excel has recalculated the required intangible benefits needed to be higher by about $15,000 ($1,077,691-$1,062,932). For this size of the urban renewal project, I would not consider this a substantial difference Cost Benefit Analysis, Slide 22 Copyright © 2004, Jim Schwab, University of Texas at Austin
Test a lower discount rate To test a lower discount rate, enter 5% in cell D2 to test the effect of a higher discount rate. Excel has recalculated the required intangible benefits needed to be lower by about $16,000 ($1,046,037-$1,062,932). For this size of the urban renewal project, I would not consider this a substantial difference We have answered all of the questions stated in the problem. Cost Benefit Analysis, Slide 23 Copyright © 2004, Jim Schwab, University of Texas at Austin
Example 2: A Highway Expansion Project This example was adapted from a problem presented in Public Policy Analysis: Applied Research Methods by Theodore H. Poister, pages 397-400. This case pertains to a hypothetical highway project in which two alternative expansion levels (expansion to a 4-lane highway and expansion to a 6-lane highway) are considered in comparison with the alternative of retaining the existing roadway. In this application, the alternatives are compared incrementally, so that the benefits and costs of expanding to a 4-lane highway are derived by comparing it with the existing roadway, and the costs and benefits corresponding to the 6-lane expansion are based on the incremental costs and benefits beyond the 4-lane highway expansion. Sequentially, then, the analysis addresses the issue of whether it is justifiable to expand to a 4-lane highway, as if so, whether it is further justified to expand to the 6-lane highway. For this problem, we will present in detail how the benefits and costs are derived. The sheet, column, and row labels have been entered into the workbook, HighwayProject.xls. Cost Benefit Analysis, Slide 24 Copyright © 2004, Jim Schwab, University of Texas at Austin
The benefit of travel time saved by the proposed highways The average time spent per trip declines dramatically with the expansion to the 4-lane highway, and then modestly as we move to the 6-lane highway expansion. Average driving time per trip on the existing highway is estimated to be 30 minutes. If the highway is expanded to 4-lanes, the average trip time drops to 18 minutes. If the highway is expanded to 6-lanes, the average trip time drops an additional two minutes to 16 minutes. Cost Benefit Analysis, Slide 25 Copyright © 2004, Jim Schwab, University of Texas at Austin
Computing the time cost per trip Setting the value of the driver’s time at $2.00 per hour, the time cost per trip is computed by dividing the number of minutes in the average trip by 60 and then multiplying by $2.00. In cell B3, enter the formula =B2/60*2. In cell C3, enter the formula =C2/60*2. In cell D3, enter the formula =D2/60*2. Cost Benefit Analysis, Slide 26 Copyright © 2004, Jim Schwab, University of Texas at Austin
Total cost per trip Other trip costs increase slightly at the first expansion level (from $1.75 to $1.90), because of higher and less efficient operating speeds, and then decrease slightly at the second expansion level (from $1.90 to $1.85) because of improved maneuverability in dispersed traffic. Enter $1.75 in cell B4, $1.90 in cell C4, and $1.85 in cell D4. Total variable cost per trip is computed by adding ‘Time cost per trip’ and ‘Other costs per trip’. Enter =B3+B4 in cell B5, =C3+C4 in cell C5, and =D3+D4 in cell D5. Cost Benefit Analysis, Slide 27 Copyright © 2004, Jim Schwab, University of Texas at Austin
Cost savings per trip The cost savings per trip when expanding to the 4-lane highway is the difference between the total variable costs for the existing highway ($2.75) and the 4-lane highway ($2.50) which equals $.25. Enter the formula =B5-C5 in cell C6. The cost savings per trip when expanding to the 6-lane highway is the difference between the total variable costs for the 4-lane highway ($2.50) and the 6-lane highway ($2.38) which equals $.12. Enter the formula =C5-D5 in cell D6. Cost Benefit Analysis, Slide 28 Copyright © 2004, Jim Schwab, University of Texas at Austin
Computing cost savings on current trips First, we enter the same number of trips per year for each highway condition, 1 million trips per year in cells B8, C8, and D8. It is likely that the number of trips would increase because of improved travel. Estimating savings based on the existing number of trips is, therefore, a conservative estimate of the probable savings. Second, to compute the cost savings for all trips, we multiply the cost savings per trip on row 6 by the number of trips per year on row 8. Enter =C6*C8 in cell C9 and =D6*D8 in cell D9. Cost Benefit Analysis, Slide 29 Copyright © 2004, Jim Schwab, University of Texas at Austin
Projected savings worksheet First, copy the cost savings for each of the expansion projects from cells C9 through D9 on the ‘Cost-benefit Analysis’ worksheet and Paste Special the Values into cells B2 through C2 on the ‘Projected Savings’ worksheet. Second, fill the annual savings down for a twenty-five year time period. For this problem, the present value of the benefits stream is computed by assuming that the same amount of benefit will accrue for each of 25 years into the future. Highlight cells B2 through C26 and select the Fill > Down command from the Edit menu. Cost Benefit Analysis, Slide 30 Copyright © 2004, Jim Schwab, University of Texas at Austin
Compute NPV of savings for 4 lane expansion First, select the cell in which we Excel to return the present value of the savings, cell C10 on the Cost-benefit Analysis worksheet. Second, select the Function command from the Insert menu. Cost Benefit Analysis, Slide 31 Copyright © 2004, Jim Schwab, University of Texas at Austin
Locate the NPV function We will search for the NPV function. First, type NPV in the Search for text box, and click on the Go button. The NPV function name will appear in the Select a function list box. Click on the OK button access the dialog box where the function arguments are entered. Cost Benefit Analysis, Slide 32 Copyright © 2004, Jim Schwab, University of Texas at Austin
The arguments to the NPV function The first argument to the NPV function is the discount rate, which we will enter directly as 8%. The second argument to the NPV function is the cells containing the projected savings for 4 lane expansion, 'Projected Savings'!B2:B26. Remember to enter the quote marks around the name of the worksheet Projected Savings because it contains a space. With the arguments entered, click on the OK button. Cost Benefit Analysis, Slide 33 Copyright © 2004, Jim Schwab, University of Texas at Austin
NPV for projected savings for 4 lane expansion The NPV function returns the present value of the projected savings for 4 lane expansion, $2,668,694.05. Cost Benefit Analysis, Slide 34 Copyright © 2004, Jim Schwab, University of Texas at Austin
Compute NPV of projected savings for 6 lane expansion First, select the cell in which we Excel to return the present value of the savings, cell D10 on the Cost-benefit Analysis worksheet. Second, select the Function command from the Insert menu. Cost Benefit Analysis, Slide 35 Copyright © 2004, Jim Schwab, University of Texas at Austin
Locate the NPV function We will search for the NPV function. First, type NPV in the Search for text box, and click on the Go button. The NPV function name will appear in the Select a function list box. Click on the OK button access the dialog box where the function arguments are entered. Cost Benefit Analysis, Slide 36 Copyright © 2004, Jim Schwab, University of Texas at Austin
The arguments to the NPV function The first argument to the NPV function is the discount rate, which we will enter directly as 8%. The second argument to the NPV function is the cells containing the projected savings for 6 lane expansion, 'Projected Savings'!C2:C26. Remember to enter the quote marks around the name of the worksheet Projected Savings because it contains a space. With the arguments entered, click on the OK button. Cost Benefit Analysis, Slide 37 Copyright © 2004, Jim Schwab, University of Texas at Austin
NPV for projected savings for 6 lane expansion The NPV function returns the present value of the projected savings for 6 lane expansion, $1,245,394.11. Cost Benefit Analysis, Slide 38 Copyright © 2004, Jim Schwab, University of Texas at Austin
The costs of the highway projects - 1 The expansion to a 4-lane highway will cost $2,000,000 in construction costs. Enter $2,000,000 in cell C13. Similarly, the expansion to 6 lanes will cost an additional $2,000,000. Enter $2,000,000 in cell D13. Cost Benefit Analysis, Slide 39 Copyright © 2004, Jim Schwab, University of Texas at Austin
The costs of the highway projects - 2 The annual maintenance costs for both the existing highway and each of the alternatives is entered in the worksheet. Enter $20,000 in cell B14, $30,000 in cell C14, and $50,000 in cell D14. Cost Benefit Analysis, Slide 40 Copyright © 2004, Jim Schwab, University of Texas at Austin
The costs of the highway projects - 3 The increase in maintenance costs are computed by subtracting the existing roadway maintenance costs from the 4-lane expansion maintenance costs and subtracting the 4-lane expansion maintenance costs from the 6-lane maintenance costs. Second, enter the formula =D14-C14 in cell D15 to compute the increase in maintenance costs associated with adding two additional lanes to the 4 lane highway. First, enter the formula =C14-B14 in cell C15 to compute the increase in maintenance costs associated with the expansion to 4 lanes. Cost Benefit Analysis, Slide 41 Copyright © 2004, Jim Schwab, University of Texas at Austin
Annual Maintenance worksheet First, copy the increase in maintenance costs for each of the expansion projects from cells C15 through D15 on the ‘Cost-benefit Analysis’ worksheet and Paste Special the Values into cells B2 through C2 on the ‘Annual Maintenance’ worksheet. Second, fill the annual maintenance cost increases down for a twenty-five year time period. For this problem, the present value of the cost stream is computed by assuming that the same amount of maintenance costs will be incurred for each of 25 years into the future. Highlight cells B2 through C26 and select the Fill > Down command from the Edit menu. Cost Benefit Analysis, Slide 42 Copyright © 2004, Jim Schwab, University of Texas at Austin
Compute NPV of increased maintenance for 4 lane expansion First, select the cell in which we Excel to return the present value of the increased maintenance, cell C16 on the Cost-benefit Analysis worksheet. Second, select the Function command from the Insert menu. Cost Benefit Analysis, Slide 43 Copyright © 2004, Jim Schwab, University of Texas at Austin
Locate the NPV function We will search for the NPV function. First, type NPV in the Search for text box, and click on the Go button. The NPV function name will appear in the Select a function list box. Click on the OK button access the dialog box where the function arguments are entered. Cost Benefit Analysis, Slide 44 Copyright © 2004, Jim Schwab, University of Texas at Austin
The arguments to the NPV function The first argument to the NPV function is the discount rate, which we will enter directly as 8%. The second argument to the NPV function is the cells containing the increased maintenance for 4 lane expansion, 'Projected Savings'!B2:B26. Remember to enter the quote marks around the name of the worksheet Annual Maintenance because it contains a space. With the arguments entered, click on the OK button. Cost Benefit Analysis, Slide 45 Copyright © 2004, Jim Schwab, University of Texas at Austin
NPV for increased maintenance for 4 lane expansion The NPV function returns the present value of the increased maintenance for 4 lane expansion, $106,747.76. Cost Benefit Analysis, Slide 46 Copyright © 2004, Jim Schwab, University of Texas at Austin
Compute NPV of maintenance for 6 lane expansion First, select the cell in which we Excel to return the present value of the increased maintenance, cell D16 on the Cost-benefit Analysis worksheet. Second, select the Function command from the Insert menu. Cost Benefit Analysis, Slide 47 Copyright © 2004, Jim Schwab, University of Texas at Austin
Locate the NPV function We will search for the NPV function. First, type NPV in the Search for text box, and click on the Go button. The NPV function name will appear in the Select a function list box. Click on the OK button access the dialog box where the function arguments are entered. Cost Benefit Analysis, Slide 48 Copyright © 2004, Jim Schwab, University of Texas at Austin
The arguments to the NPV function The first argument to the NPV function is the discount rate, which we will enter directly as 8%. The second argument to the NPV function is the cells containing the increased maintenance for 6 lane expansion, 'Projected Savings'!C2:C26. Remember to enter the quote marks around the name of the worksheet Annual Maintenance because it contains a space. With the arguments entered, click on the OK button. Cost Benefit Analysis, Slide 49 Copyright © 2004, Jim Schwab, University of Texas at Austin
NPV for increased maintenance for 6 lane expansion The NPV function returns the present value of the increased maintenance for 6 lane expansion, $213,495.52. Cost Benefit Analysis, Slide 50 Copyright © 2004, Jim Schwab, University of Texas at Austin