Download
1 / 21
210 likes | 336 Views
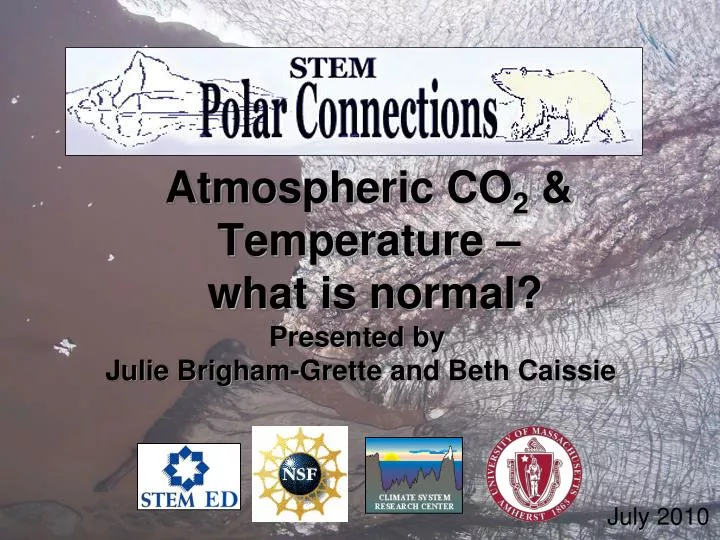
Atmospheric CO 2 & Temperature – what is normal?. Presented by Julie Brigham-Grette and Beth Caissie. July 2010. CO 2 and Temperature—What is Normal?. Concepts to Address before you begin Climate vs. Weather Greenhouse Gasses The Carbon Cycle Play the game?

E N D
Atmospheric CO2 & Temperature – what is normal? Presented by Julie Brigham-Grette and Beth Caissie July 2010
CO2 and Temperature—What is Normal? • Concepts to Address before you begin • Climate vs. Weather • Greenhouse Gasses • The Carbon Cycle • Play the game? • Photosynthesis and Decomposition • Concepts to grasp During the Activity • How much of a change in CO2 concentration and other GHGs is natural? • What is the normal range of CO2 and temperature variability? How is normal defined in this context? • What is the relationship between CO2 and global temperatures?
http://www.esrl.noaa.gov/gmd/ccgg/trends/ Seasonal changes cause up/downs in CO2 in the atmosphere Especially driven by Northern Hemisphere. Spring - photosynthesis drops CO2, Fall - decomposition causes increase in CO2
Monitoring of CO2 and other Greenhouse gases around the world All get similar measurements Why?
Global View CO2 http://www.esrl.noaa.gov/gmd/ccgg/globalview/co2/co2_intro.html
Drilling in Greenland http://passporttoknowledge.com/polar-palooza/pp09a.php Video podcast from Polar Palooza
Matt Nolan, UAF Fossil air! Trapped in the ice; records past atmosphere Summit Station, Greenland photo by Michael Morrison, GISP2 SMO, University of New Hampshire; NOAA Paleoslide SetCore: Eric Cravens, Assistant Curator, U.S. National Ice Core Laboratory;
Raynaud, 1992 Gases within bubbles = fossil atmospheric air
Firn-ice transition • Depth of transition depends on surface temperature and accumulation rate • Camp Century, Greenland: ~68 m below ice sheet surface • Vostok, Antarctica: ~100 m below ice sheet surface Low precip. and cold = long time to make ice High precip. and warm =short time to make ice
Analysis: Defining amplitude, frequency, periodicity Defining Normal? Understanding the relationship between Greenhouse gases and temperature. Classroom options: Plot by hand on graph paper, Plot on computer using Excel Overlay Temperature on CO2 Instructions for Excel on website
Oxygen (8 protons) 16O 17O 18O 99.8% 0.04% 0.2% Hydrogen (1 proton) 1H 2H (Deuterium) 3H (tritium) 99.98% 0.016% (bombs) So, can make 9 isotopic combinations of H2O, e.g., 18 (1H216O) to 22 (2H218O) “light water” “heavy water” In paleoclimate studies…1H1H16O to 1H218O
General Equation: 18O = 18O/16O sample - 18O/16O standard x 1000 18O/16O standard Expressed in per mille (0/00) Negative values = lower ratios = isotopically lighter (less 18O than 16O) Positive values = higher ratios = isotopically heavier (more 18O than 16O)
d18O isotopic depletion -50 -40 -30 -20 Evaporation of more 16O Ice Sheet -10 0 ocean In Sea In Ice Glacials = enriched 18O depleted 18O Interglacials = depleted 18O enriched 18O
dD isotopic depletion depends on temp of source area, Distance and processes during precipitation Ice Sheet ocean Isotopic ratios are used to model temperature, at Vostok; empirically this is roughly: Temperature (deg-C) = -55.5 + (δD + 440) / 6 http://eesc.columbia.edu/courses/ees/climate/labs/vostok/ See also http://www.globalchange.umich.edu/gctext/Inquiries/Inquiries_by_Unit/Unit_8a.htm
http://earthobservatory.nasa.gov/Library/CarbonCycle/carbon_cycle4.htmlhttp://earthobservatory.nasa.gov/Library/CarbonCycle/carbon_cycle4.html