Download
1 / 20
200 likes | 309 Views
Libo Cao, Guoxiang Chen 1 , and Peter de B. Harrington 2 Libo.cao@ohio.edu Guoxiang.Chen@ohio.edu Peter.Harrington@ohio.edu Ohio University Center for Intelligent Chemical Instrumentation Department of Chemistry & Biochemistry, Athens, OH 45701-2979

E N D
Libo Cao, Guoxiang Chen1, and Peter de B. Harrington2 Libo.cao@ohio.eduGuoxiang.Chen@ohio.eduPeter.Harrington@ohio.edu Ohio University Center for Intelligent Chemical Instrumentation Department of Chemistry & Biochemistry, Athens, OH 45701-2979 1 Research & Development Scientist, Metara Inc., 1225 E Arques Ave, Sunnyvale, CA 94085-4701 2 Faculty Fellow, Idaho National Engineering and Environmental Lab, Idaho Falls, ID 83401-2208 The 50th ASMS Conference, 2002 Histogram Mass Spectra Lose Key Chemical Information: Are Wavelet Compressed Mass Spectral Profiles a Viable Alternative? Ohio University Center for Intelligent Chemical Instrumentation
Abstract An overlooked computational preprocessing step is the integration of mass spectral peaks and rendering a spectrum in the form of a histogram. With technological advances, mass spectral profiles can be processed thereby retaining information in the ion peak shapes. Although the size of the mass spectral profile can be quite larger than a histogram, nonlinear wavelet compression can reduce the spectra to a manageable size. This approach is important to other areas such as the mass measurement of large ions for which baseline resolution is unobtainable and integrated peak areas do convey the accurate abundance. Principal component analysis (PCA) in many ways forms the basis for multivariate data analysis [1-2]. PCA provides an approximation of a data matrix, A as a product of two smaller matrices T and P that have orthogonal columns. Also the columns maximize the variance of A. Recently, there have been efforts to introduce data compression to chemometrics. Data compression is able to reduce data size without losing important chemical information. Data noise can be lowered and implementation of algorithms can be greatly speeded up. Wavelet transform (WT) has gained a position as a popular compressing and denoising technique in the field of analytical chemistry due to its fast implementation, large number of available basis functions, and Ohio University Center for Intelligent Chemical Instrumentation
multiresolution ability. The WT technique has been exploited to processing absorbance spectra [3-4], chromatograms [5], and electrochemical signals [6]. Wavelet transform has been used with the other chemometric approaches such as PCA [7], partial least squares analysis [8], and artificial neural network [9]. Reviews and tutorials about wavelet transform are available [10]. Mass spectra were collected on a Hewlett Packard 5988 gas chromatograph-mass spectrometer (GC/MS). The data acquisition was acquired with a personal computer and the OS/2 Warp 4.0 operating system. The mass spectrometer was controlled using Prolab Vector/Two GC-LC/MS software, version 3.02.00. The GC/MS data were processed using a LabVIEW virtual instrument (VI) that performed histogram calculations at a resolution of 0.1 m/z and generated mass spectral profiles with a data point interval of 0.12 m/z. The same spectra were used for comparisons at different resolutions and formats. Difficult to distinguish isomers were used to demonstrate the benefits of using profiles instead of histograms. Three xylene isomers were run individually on the GC/MS and their spectra were collected as mass profiles. The spectra were converted to histograms with Ohio University Center for Intelligent Chemical Instrumentation
integrated peak areas using 0.1 mass resolutions. The spectra were then normalized, mean-centered and displayed on the first two or three principal components. The same spectra were treated as mass profiles. Resolution values were calculated by measuring the distance between each pair of averages for each isomer and dividing this value by the average of the two standard deviations about the averages multiplied by four. References [1] F. Malinowski and D. Howery, Factor Analysis in Chemistry; Wiley: New York, 1980 [2] L.S. Ramos, K.R. Beebe, W.P. Carey, E. Sanchez, B.C.Erickson, B.E. Wilson, L.E. Wangen and B.R. Kowalski, Anal. Chem., 58 (1986) 294R-315R. [3] B. Walczak and D. L. Massart, Chemomet. Intell. Lab. Syst., 36 (1997) 81. [4] F. Ehrentreich and L. Sümmmchen, Anal. Chem. 73 (2001) 4364. [5] J. Lasa, I. Sliwka, J. Rosiek and K. Wal, Chemia Analityczna, 46 (2001) 529. [6] H. Chen, Anal. Chim. Acta 346 (1997) 319. [7] B. Walczak and D. L. Massart, Chemomet. Intell. Lab. Syst. 38 (1997) 39. [8] S. Ren and L. Gao, Talanta 50 (2000) 1163 [9] C. Cai and P. B. Harrington, J. Chem. Inf. Comput. Sci. 39 (1999) 874. [10] B. Walczak, Wavelets in chemistry; Elsevier: Amsterdam, 2000. Ohio University Center for Intelligent Chemical Instrumentation
MS Histogram Integration m/z m/z Ohio University Center for Intelligent Chemical Instrumentation
Comparison Between Two Mass Spectra from Different Resolutions (Binned MS) Resolution: 1.0 m/z Resolution: 0.016 m/z m/z m/z Ohio University Center for Intelligent Chemical Instrumentation
Data Acquisition and Analysis Procedure Mass Spectra Data Acquisition ProLab Vector/Two Hewlett Packard 5988 GC/MS PC and OS/2 Warp 4.0 GC-LC/MS software PCA Analysis Resolution Evaluation LabVIEW VI Spectra Normalization Data mean-centered Displayed on the key principal components Histogram calculations at different resolutions Ohio University Center for Intelligent Chemical Instrumentation
LabVIEW VI for Processing GC/MS data Ohio University Center for Intelligent Chemical Instrumentation
GC/MS VI Wiring Diagram Ohio University Center for Intelligent Chemical Instrumentation
Binned Integration VI Wiring Diagram Ohio University Center for Intelligent Chemical Instrumentation
Algorithm for Bin Integration m/z Intensity 90.23 1125 90.52 3452 90.71 12543 Sum 90.95 20345 91.31 10893 91.56 2453 Relative Intensity } Normalization 47233 47233 Base peak Ohio University Center for Intelligent Chemical Instrumentation
Principal Component Analysis (PCA) PCA provides an approximation of a data matrix, A as a product of two smaller matrices T and P that have orthogonal columns. Also the columns maximize the variance of A. A = TPT • A – A data matrix containing intensities from m/z 51 to m/z 150 measured from 30 spectra for the same chemical compound • T – A 30 × n matrix that describes the mass spectra at different retention times; n is number of components. • PT– An n × 100 matrix that describes the mass spectral intensities from m/z 51 to m/z 150 Ohio University Center for Intelligent Chemical Instrumentation
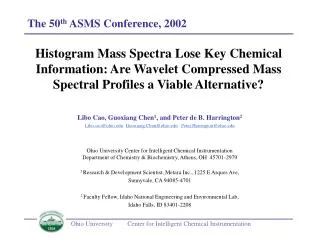
PCA Algorithm P1 Var3 Var2 ti1 ti Var1 A data matrix X is represented as a cluster of N points in a K-dimensional space. This figure shows a three-dimensional space with a straight line fitted to the points: the line is a one-component PC model. The PC score of an object (ti) is its orthogonal projection onto the PC. The PC is also referred to as the variable loadings. Ohio University Center for Intelligent Chemical Instrumentation
PC Scores from the Integrated Histogram Data Ohio University Center for Intelligent Chemical Instrumentation
PC Scores from Binned Spectra Ohio University Center for Intelligent Chemical Instrumentation
High Resolution Binned Spectra Improved the Separation Among the Isomers Ohio University Center for Intelligent Chemical Instrumentation
Comparison of Scores Obtained from Two Different Binned Sizes PCA1 (76.4%) PCA2 (20.1%) PCA3 (3.1%) PCA1 (58.9%) PCA2 (40.1%) PCA3 (1.0%) Ohio University Center for Intelligent Chemical Instrumentation
Xylene Resolutions from Different Data Treatments Resolution Isomers Resolution values were calculated by measuring the distance between each pair of averages for each isomer and dividing this value by the average of the two standard deviations about the averages multiplied by four. Ohio University Center for Intelligent Chemical Instrumentation
Future Work Wavelet compression for MS spectra Data compression in analytical chemistry aims at major savings of storage space and speeding up calculations. Using the wavelet compressed profiles improved the resolution and allowed the identification of the three isomers from their mass spectra. Applications of automated pattern recognition Because wavelet compressed profiles include useful information that is lost during integration of the mass spectral peaks. The integrated peak areas are typically reported as histograms for mass spectral data. More applications of automated pattern recognition should be explored. Applications of automated pattern recognition Because wavelet compressed profiles include useful information that is lost during integration of the mass spectral peaks. The integrated peak areas are typically reported as histograms for mass spectral data. More applications of automated pattern recognition should be explored. Ohio University Center for Intelligent Chemical Instrumentation
Erin Kolbrich Jennifer Cline Maggie Lerch Yuka Minoshima Acknowledgments • Tricia Buxton • Mariela Ochoa • Preshious Rearden • Bryon Moore Ohio University The Idaho National Engineering & Research Laboratory Metara Inc. Ohio University Center for Intelligent Chemical Instrumentation