Download
1 / 24
240 likes | 397 Views
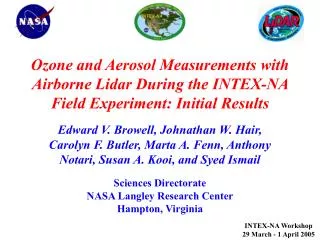
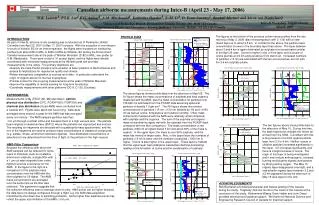
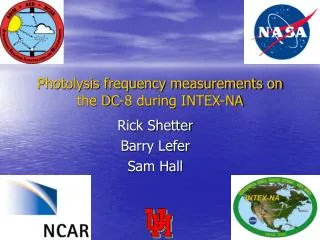
Photolysis frequency measurements on the DC-8 during INTEX-NA. Rick Shetter Barry Lefer Sam Hall. SAFS Instrument. Scanning Actinic Flux Spectroradiometer (SAFS). Quartz optical collection head 2 steradian light collection 30 cm Artificial Horizon

E N D
Photolysis frequency measurements on the DC-8 during INTEX-NA Rick Shetter Barry Lefer Sam Hall
SAFS Instrument Scanning Actinic Flux Spectroradiometer (SAFS) Quartz optical collection head 2 steradian light collection 30 cm Artificial Horizon Fiber Optic Bundles for light transfer High OH fused silica for high UV throughput 10 meter length, 37 fibers Round to slit configuration for max throughput 1/8 meter Double Monochromator Focal Length 110 mm Wavelength accuracy <0.1 nm Stray light rejection <10-9 Resolution 1 nm FWHM Photomultiplier Bialkali photocathode Low dark current selected <0.04 nA Picoammeter/Amplifier 4 output stages with 108, 107, 106 and 105 gains Scan Acquisition Time 10-30 s
UV-VIS Actinic Flux Spectrum O3 + hv → O2 + O(1D) [j-O(1D)]
UV-VIS Actinic Flux Spectrum NO2 + hv → NO + O(3P) [j-NO2]
CCD Actinic Flux Spectroradiometer (CAFS) system Detector Enclosure Actinic Flux Optical Collector Quartz domes and light guide optimized for angular and azimuth independent light collection Artificial horizon to limit field of view to 2πsteradians Custom UV fiber optic bundle Multi-fiber bundle with homogenizers on both ends Monolithic monochromator Ceramic body with epoxy attached slit, grating, and CCD detector for temperature and vibration stability Back thinned blue enhanced windowless cooled CCD detector Detector maintained at -1.0 ̊ C Detector electronics average multiple spectra on electronics to minimize detector read noise Electronics Enclosure Power supplies for CCD cooling and logic PC-104 data acquisition and control computer
Instrument Specifications Wavelength Dependent Actinic Flux Measurements Wavelength range: 280-400 nm (limited by UG-11 filter) Wavelength resolution: ~2.2 nm FWHM at 297 nm Accuracy: 5% in UV-B, 3% in UV-A/VIS dependent on NIST standards Detection limit: ~0.04 mW/m2/nm at 300 nm Precision: <1 % depending on wavelength Spectral acquisition: 70 and 200 ms spectra (2 sec) Weight: <23 kg per instrument Power: <15 amps of 28 volt DC per inst Location on DC-8: Zenith 1
Tropospheric Ultraviolet and Visible (TUV) Radiation Model TUV version 4.1 8-stream discrete ordinate radiative transfer method with a pseudo-spherical modification Model Inputs: Latitude Longitude Altitude Surface albedo Vertical profiles of SO2, NO2, O3 Aerosol / cloud properties [http://www.acd.ucar.edu/TUV/]
Tropospheric Ultraviolet and Visible (TUV) Radiation Model Aerosol Properties in TUV Aerosol optical depth () Angstrom Coefficient () Aerosol single scattering albedo () Aerosol asymmetry factor (g)
j -value Impact Factor Value close to 1 = Measurements and RT Model Agree Less than 1 = Cloud/aerosol reduction of j -values Greater than 1 = Cloud/aerosol enhancement of j -values
Satellite Underpass Locations and Flights Flight Location Time Satellite Flt 3 Spiral Far West Of Trinidad Head 21:30-22:00 Terra Flt 4 (In Progress Double Back Pelston,MI) 21:15-21:45 Flt 5 Spiral N Il Near Rockport 17:15-17:45 Aqua Flt 6 Spiral West PA 15:45-16:15 (?Aqua) Spiral Ga/NC/SC/TN Intersection 18:30-19:00 Aqua Flt 7 Spiral Northern WI, Rhinelander, 16:00-16:30 Spiral North Central OK –ARM Site 19:30-20:00 Flt 8 Spiral Rhinelander WI 14:15-14:45 Rhinelander WI 17:15-17:45 Terra In Progress Upmi-North Bay, Ont 18:00-19:00 Aqua Flt 9 PEI Gulf Of St Lawrence 15:30-16:00 South New Foundland 16:30-17:00 Aqua Flt 10 Northcentral,IL 18:45-19:15 Aqua Flt 11 Gulf Of Maine 16:00-16:30 Terra Flt 12 East Of FL 16:30 17:00 Terra Flt 14 Very Far East Of Cape Cod; 15:00-15:30 Terra In Progress, Vf East Hatteras 16:30-17:30 Aqua Flt 15 North Gulf Of St Lawrence 16:15-16:45 Terra & Aqua Flt 16 Eastern TN 16:30-17:00 Terra Flt 17 East Of Cape Cod, 15:15-15:45 Terra Flt 18 Very Far East Of Cape Hatteras 15:00-15:30 Terra Ky/WV 18:40-19:10 Aqua Flt 19 Gulf Of Mexico/MS 15:40-16:10 Terra Gulf Of Mexico/La 18:50-19:20 Aqua Flt 20 Trinidad Head 22:40-23:10
INTEX-AActinic Flux/Photolysis Frequency Research Questions - Impact of clouds and aerosols on photochemistry during INTEX-A (0-D and 3-D models). - Comparison of RT model and measurements using aerosol properties (AOD, ssa, angstrom, etc)from: satellite retrievals in situ measurements model calculations - SAFS v CAFS: performance, calculated photolysis frequencies.