Download
1 / 1
10 likes | 100 Views
Canadian airborne measurements during Intex-B (April 23 - May 17, 2006) W.R. Leaitch 1 , P.S.K. Liu 1 K.G. Anlauf 1 , A.M. Macdonald 1 , Katherine Hayden 1 , S.-M. Li 1 , D. Toom-Sauntry 1 , Randall Martin2 and Aaron van Donkelaar2

E N D
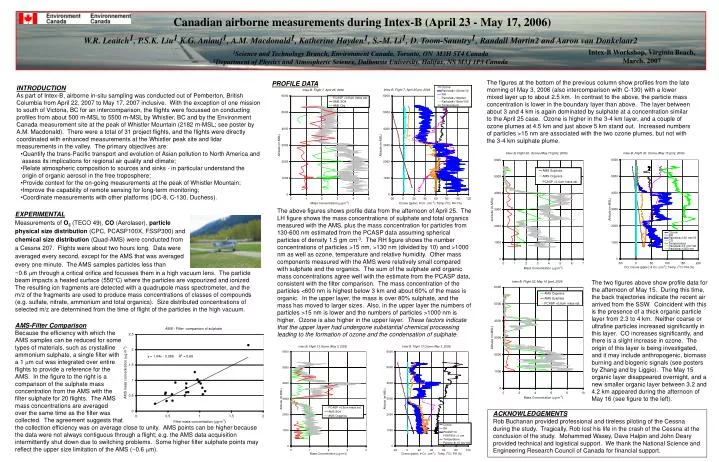
Canadian airborne measurements during Intex-B (April 23 - May 17, 2006) W.R. Leaitch1, P.S.K. Liu1 K.G. Anlauf1, A.M. Macdonald1, Katherine Hayden1, S.-M. Li1, D. Toom-Sauntry1,Randall Martin2 and Aaron van Donkelaar2 1Science and Technology Branch, Environment Canada, Toronto, ON M3H 5T4 Canada 2Department of Physics and Atmospheric Science, Dalhousie University, Halifax, NS M3J 1P3 Canada Intex-B Workshop, Virginia Beach, March, 2007 The figures at the bottom of the previous column show profiles from the late morning of May 3, 2006 (also intercomparison with C-130) with a lower mixed layer up to about 2.5 km. In contrast to the above, the particle mass concentration is lower in the boundary layer than above. The layer between about 3 and 4 km is again dominated by sulphate at a concentration similar to the April 25 case. Ozone is higher in the 3-4 km layer, and a couple of ozone plumes at 4.5 km and just above 5 km stand out. Increased numbers of particles >15 nm are associated with the two ozone plumes, but not with the 3-4 km sulphate plume. PROFILE DATA • INTRODUCTION • As part of Intex-B, airborne in-situ sampling was conducted out of Pemberton, British Columbia from April 22, 2007 to May 17, 2007 inclusive. With the exception of one mission to south of Victoria, BC for an intercomparison, the flights were focussed on conducting profiles from about 500 m-MSL to 5500 m-MSL by Whistler, BC and by the Environment Canada measurement site at the peak of Whistler Mountain (2182 m-MSL; see poster by A.M. Macdonald). There were a total of 31 project flights, and the flights were directly coordinated with enhanced measurements at the Whistler peak site and lidar measurements in the valley. The primary objectives are: • Quantify the trans-Pacific transport and evolution of Asian pollution to North America and assess its implications for regional air quality and climate; • Relate atmospheric composition to sources and sinks - in particular understand the origin of organic aerosol in the free troposphere; • Provide context for the on-going measurements at the peak of Whistler Mountain; • Improve the capability of remote sensing for long-term monitoring; • Coordinate measurements with other platforms (DC-8, C-130, Duchess). The above figures shows profile data from the afternoon of April 25. The LH figure shows the mass concentrations of sulphate and total organics measured with the AMS, plus the mass concentration for particles from 130-600 nm estimated from the PCASP data assuming spherical particles of density 1.5 gm cm-3. The RH figure shows the number concentrations of particles >15 nm, >130 nm (divided by 10) and >1000 nm as well as ozone, temperature and relative humidity. Other mass components measured with the AMS were relatively small compared with sulphate and the organics. The sum of the sulphate and organic mass concentrations agree well with the estimate from the PCASP data, consistent with the filter comparison. The mass concentration of the particles <600 nm is highest below 3 km and about 60% of the mass is organic. In the upper layer, the mass is over 80% sulphate, and the mass has moved to larger sizes. Also, in the upper layer the numbers of particles >15 nm is lower and the numbers of particles >1000 nm is higher. Ozone is also higher in the upper layer. These factors indicate that the upper layer had undergone substantial chemical processing leading to the formation of ozone and the condensation of sulphate. EXPERIMENTAL Measurements of O3 (TECO 49), CO (Aerolaser), particle physical size distribution (CPC, PCASP100X, FSSP300) and chemical size distribution (Quad-AMS) were conducted from a Cessna 207. Flights were about two hours long. Data were averaged every second, except for the AMS that was averaged every one minute. The AMS samples particles less than ~0.6 m through a critical orifice and focusses them in a high vacuum lens. The particle beam impacts a heated surface (550°C) where the particles are vapourized and ionized. The resulting ion fragments are detected with a quadrupole mass spectrometer, and the m/z of the fragments are used to produce mass concentrations of classes of compounds (e.g. sulfate, nitrate, ammonium and total organics). Size distributed concentrations of selected m/z are determined from the time of flight of the particles in the high vacuum. The two figures above show profile data for the afternoon of May 15. During this time, the back trajectories indicate the recent air arrived from the SSW. Coincident with this is the presence of a thick organic particle layer from 2.3 to 4 km. Neither coarse or ultrafine particles increased significantly in this layer. CO increases significantly, and there is a slight increase in ozone. The origin of this layer is being investigated, and it may include anthropogenic, biomass burning and biogenic signals (see posters by Zhang and by Liggio). The May 15 organic layer disappeared overnight, and a new smaller organic layer between 3.2 and 4.2 km appeared during the afternoon of May 16 (see figure to the left). AMS-Filter Comparison Because the efficiency with which the AMS samples can be reduced for some types of materials, such as crystalline ammonium sulphate, a single filter with a 1 mm cut was integrated over entire flights to provide a reference for the AMS. In the figure to the right is a comparison of the sulphate mass concentration from the AMS with the filter sulphate for 20 flights. The AMS mass concentrations are averaged over the same time as the filter was collected. The agreement suggests that the collection efficiency was on average close to unity. AMS points can be higher because the data were not always contiguous through a flight; e.g. the AMS data acquisition intermittently shut down due to switching problems. Some higher filter sulphate points may reflect the upper size limitation of the AMS (~0.6 m). ACKNOWLEDGEMENTS Rob Buchanan provided professional and tireless piloting of the Cessna during the study. Tragically, Rob lost his life in the crash of the Cessna at the conclusion of the study. Mohammed Wasey, Dave Halpin and John Deary provided technical and logistical support. We thank the National Science and Engineering Research Council of Canada for financial support.