Download

1 / 22
230 likes | 443 Views
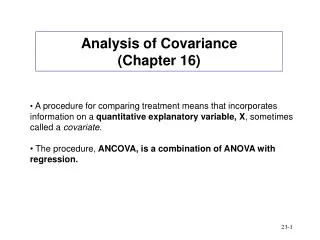
Analysis of Covariance. David Markham djmarkham@bsu.edu. Analysis of Covariance. Analysis of Covariance (ANCOVA) is a statistical test related to ANOVA It tests whether there is a significant difference between groups after controlling for variance explained by a covariate

E N D
Analysis of Covariance David Markham djmarkham@bsu.edu
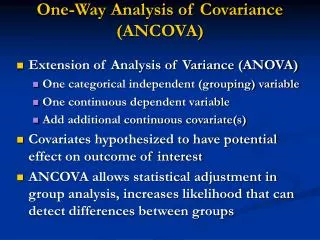
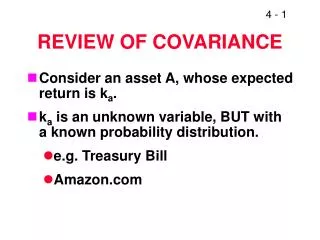
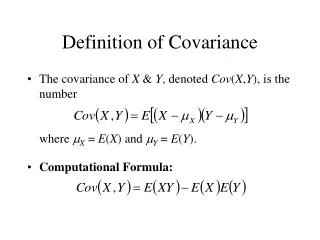
Analysis of Covariance • Analysis of Covariance (ANCOVA) is a statistical test related to ANOVA • It tests whether there is a significant difference between groups after controlling for variance explained by a covariate • A covariate is a continuous variable that correlates with the dependent variable
So, what does all that mean? • This means that you can, in effect, “partial out” a continuous variable and run an ANOVA on the results • This is one way that you can run a statistical test with both categorical and continuous independent variables
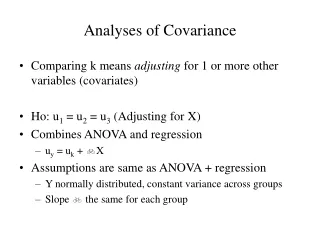
Hypotheses for ANCOVA • H0 and H1 need to be stated slightly differently for an ANCOVA than a regular ANOVA • H0: the group means are equal after controlling for the covariate • H1: the group means are not equal after controlling for the covariate
Assumptions for ANCOVA ANOVA assumptions: • Variance is normally distributed • Variance is equal between groups • All measurements are independent Also, for ANCOVA: • Relationship between DV and covariate is linear • The relationship between the DV and covariate is the same for all groups
How does ANCOVA work? • ANCOVA works by adjusting the total SS, group SS, and error SS of the independent variable to remove the influence of the covariate • However, the sums of squares must also be calculated for the covariate. For this reason, SSdv will be used for SS scores for the dependent variable, and SScv will be used for the covariate
Sum of Products • To control for the covariate, the sum of products (SP) for the DV and covariate must also be used • This is the sum of the products of the residuals for both the DV and the covariate • In the following slides, x is the covariate, and y is the DV. i is the individual subject, and j is the group.
Total Sum of Products • This is just the sum of the multiplied residuals for all data points.
Group Sum of Products • This is the sum of the products of the group means minus the grand means times the group size.
Error Sum of Products • This is the sum of the products of the DV and residual minus the group means of the DV and residual • This just happens to be the same as the difference between the other two sum of products
Adjusting the Sum of Squares • Using the SS’s for the covariate and the DV, and the SP’s, we can adjust the SS’s for the DV
Now what? • Using the adjusted SS’s, we can now run an ANOVA to see if there is a difference between groups. • This is the exact same as a regular ANOVA, but using the adjusted SS’s instead of the original ones. • Degrees of freedom are not affected
A few more things • We can also determine whether the covariate is significant by getting a F score
A few more things • The group means can also be adjusted to eliminate the effect of the covariate
Post-hocs for ANCOVA • Post-hoc tests can be done using the adjusted means for ANCOVA, including LSD and Bonferroni
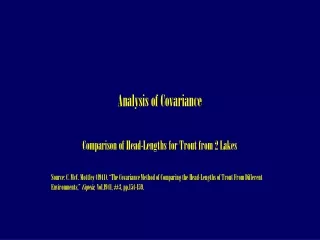
Example of ANCOVA • Imagine we gave subjects a self-esteem test, with scores of 1 to 10 • Then we primed subjects with either positive or negative emotions. • Then we asked them to spend a few minutes writing about themselves. • Our dependent measure is the number of positive emotion words they used (e.g. happy, good)
Example of ANCOVA, cont. • The null hypothesis is that the priming doesn’t make a difference after controlling for self-esteem • The alternative hypothesis is that the priming does make a difference after controlling for self-esteem
ANCOVA in SPSS • To do ANCOVA in SPSS, all you need to do is add your covariate to the “covariate” box in the “univariate” menu • Everything else is the exact same as it is for ANOVA