Download

1 / 14
140 likes | 199 Views
Understand the fundamentals of Analysis of Covariance (ANCOVA) in experimental design, utilizing pre-measures to adjust posttest scores for pretest variability. Learn how covariates reduce noise and enhance data interpretation. Discover the impact of multiple covariates and the significance of using pretest as a covariate. Explore methods to remove variability and improve data accuracy in research. Gain insights into the adjustment process and its implications on data analysis.

E N D
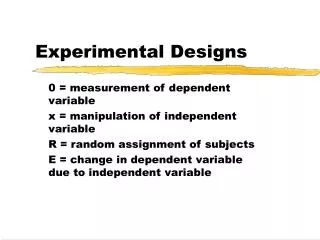
Design Notation R O X O R O O • Uses a pre-measure • Can be a pretest, but doesn’t have to be • Can have multiple covariates
1 0 0 9 0 8 0 7 0 6 0 5 0 4 0 3 0 2 0 2 0 3 0 4 0 5 0 6 0 7 0 8 0 The Covariance Design Posttest Pretest
1 0 0 9 0 8 0 7 0 6 0 5 0 4 0 3 0 2 0 2 0 3 0 4 0 5 0 6 0 7 0 8 0 The Covariance Design The range of y is about 70 points. Posttest Pretest
1 0 0 9 0 8 0 7 0 6 0 5 0 4 0 3 0 2 0 2 0 3 0 4 0 5 0 6 0 7 0 8 0 How Does a Covariate Reduce Noise? We fit regression lines to describe the pretest-posttest relationship. Posttest Pretest
1 0 0 9 0 8 0 7 0 6 0 5 0 4 0 3 0 2 0 2 0 3 0 4 0 5 0 6 0 7 0 8 0 How Does a Covariate Reduce Noise? Posttest We want to “adjust” the posttest scores for pretest variability. Pretest
1 0 0 9 0 8 0 7 0 6 0 5 0 4 0 3 0 2 0 2 0 3 0 4 0 5 0 6 0 7 0 8 0 How Does a Covariate Reduce Noise? Posttest We do this by “subtracting out” the pretest -- by “subtracting out” the line. We want to “adjust” the posttest scores for pretest variability. Pretest
1 0 0 9 0 8 0 7 0 6 0 5 0 4 0 3 0 2 0 2 0 3 0 4 0 5 0 6 0 7 0 8 0 How Does a Covariate Reduce Noise? Posttest We do this by “subtracting out” the pretest -- by “subtracting out” the line. Get the difference between the line and each point. Pretest
1 0 0 9 0 8 0 7 0 6 0 5 0 4 0 3 0 2 0 2 0 3 0 4 0 5 0 6 0 7 0 8 0 How Does a Covariate Reduce Noise? When we subtract the line from each point, it’s as though we make each line parallel to an x-axis. Posttest Pretest
Posttest 1 0 0 9 0 8 0 7 0 6 0 5 0 4 0 3 0 2 0 2 0 3 0 4 0 5 0 Pretest 6 0 7 0 8 0 How Does a Covariate Reduce Noise? Or, it’s like rotating the entire distribution until the regression lines are horizontal.
Posttest 1 0 0 9 0 8 0 7 0 6 0 5 0 4 0 3 0 2 0 2 0 3 0 4 0 5 0 Pretest 6 0 7 0 8 0 How Does a Covariate Reduce Noise? Notice how much less variability there is on y after we have “removed” the relationship to the covariate.
4 0 3 0 2 0 1 0 0 - 1 0 - 2 0 - 3 0 - 4 0 2 0 3 0 4 0 5 0 6 0 7 0 8 0 How Does a Covariate Reduce Noise? Here is the plot with the effect of the pretest removed. Notice the range on y is now only about 50 points instead of 70 (although the difference between the means remains the same). Pretest
Summary • The Analysis of Covariance adjusts posttest scores for variability on the covariate (pretest). • This is what we mean by adjusting for the effects of one variable on another.
Summary • You can use any continuous variable as the covariate, but the pretest is usually best. Why? • You can use multiple covariates, but if they are highly intercorrelated, you don’t improve the adjustment (and you pay a price for each covariate).