Promoter and Module Analysis
150 likes | 329 Views
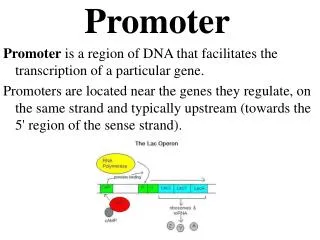
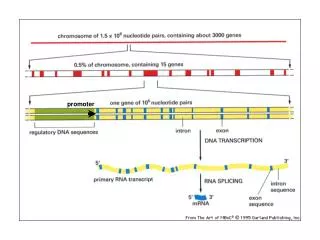
Promoter and Module Analysis. Statistics for Systems Biology. Transcription Factors. DNA binding proteins that facilitate or inhibit Pol II initiation or elongation General transcription factors: Used widely for many genes under many circumstances Specific transcription factors

Promoter and Module Analysis
E N D
Presentation Transcript
Promoter and Module Analysis Statistics for Systems Biology
Transcription Factors • DNA binding proteins that facilitate or inhibit Pol II initiation or elongation • General transcription factors: • Used widely for many genes under many circumstances • Specific transcription factors • Used to initiate specific genes under specific circumstances • Distinction may not be so sharp!
Transcription Factor Families • Several structures line up amino acids • Helix-turn-Helix (Homeodomain) • Helix-loop-helix • Zinc Finger • Mostly dimers • These families have proliferated because of their role in attracting transcription apparatus
DNA-Binding Proteins • All proteins interact weakly with DNA • Proteins with projecting amino acids interact with the DNA major groove • Hydrogen bonds stabilize position of proteins on DNA • Proteins that line up several amino acid contacts bind strongly to specific DNA sequences
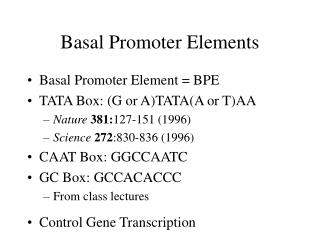
Transcription Factor Recognition Sites • Typically 6-10 positions very selective and several others show bias • Often selectivity profile summarized by ‘motif’
Selectivity of Specific T.F.’s • Most TF’s recognize 6-10 bases of DNA • E. coli: longer (8-12 bp) TF’s • All sequences are effective • Yeast: areas around promoters selectively cleared of nucleosomes • ~ 30 x accessibility for those • Animal: cooperative binding of several T.F.’s
Cofactors • Frequently the effect of DNA-binding proteins depends on co-factors • E.g. ER sits on the DNA but requires estrogen as a co-factor to function • Myc requires Max as a co-factor to stimulate transcription • If Max is coupled with Mad instead, the genes are repressed
Change in physical conformation of DNA leads to increased likelihood of spontaneous assembly of Pol II Getting Pol II further into the gene seems to require further steps Assembly of Transcription App.
Inferring Regulatory Architecture • Aim: to find which regulators influence gene expression • Concerns: • Contributions of many factors to any one gene • Approaches: • Decision tree (Computer Science) • Regression (more statistical) • DNA sequence motifs can be a surrogate
The Israeli ‘Module’ Approach • Idea: model TF binding as a ‘decision-tree’ • Steps • Cluster gene expression profiles • Fit best regulator tree to each cluster • Re-assign genes to clusters • Iterate until converge
Strengths and Weaknesses of Module Approach • Explicitly models interaction among regulators • Expression arrays give poor estimates of activity of TF’s or other regulators • Some regulators could repress genes • Discrete predictor model is inefficient
Update: Estimating TF Activity • Since TF expression data is unreliable for activity, could we do better inferring TF activity? • Use DNA sequence motifs as surrogate for TF binding • Fit double E-M – complicated!
The Regression Approach • Direct data on TF occupancy from ChIP • Two stages: • Find candidate TF’s by correlation between occupancy and sets of genes • Estimate TF activity in each condition by regression model
Regression Steps Preliminary Screen r > rthreshold