
Uploaded by
altessa
1 SLIDES
175 VIEWS
10LIKES
promoter
DESCRIPTION
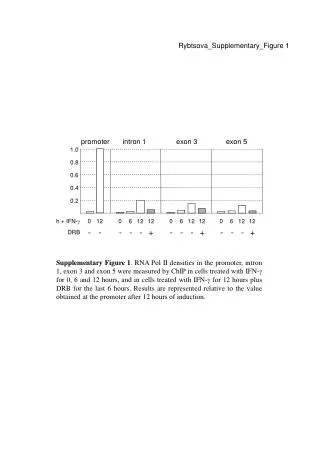
Rybtsova_Supplementary_Figure 1. promoter. intron 1. exon 3. exon 5. 1.0. 0.8. 0.6. 0.4. 0.2. h + IFN- g. 0. 12. 0. 6. 12. 12. 0. 6. 12. 12. 0. 6. 12. 12. -. -. -. -. -. +. -. -. -. +. -. -. -. +. DRB.
Download
1 / 1
Download Presentation 
promoter
An Image/Link below is provided (as is) to download presentation
Download Policy: Content on the Website is provided to you AS IS for your information and personal use and may not be sold / licensed / shared on other websites without getting consent from its author.
Content is provided to you AS IS for your information and personal use only.
Download presentation by click this link.
While downloading, if for some reason you are not able to download a presentation, the publisher may have deleted the file from their server.
During download, if you can't get a presentation, the file might be deleted by the publisher.
E N D
Presentation Transcript
Rybtsova_Supplementary_Figure 1 promoter intron 1 exon 3 exon 5 1.0 0.8 0.6 0.4 0.2 h + IFN-g 0 12 0 6 12 12 0 6 12 12 0 6 12 12 - - - - - + - - - + - - - + DRB Supplementary Figure 1. RNA Pol II densities in the promoter, intron 1, exon 3 and exon 5 were measured by ChIP in cells treated with IFN-g for 0, 6 and 12 hours, and in cells treated with IFN-g for 12 hours plus DRB for the last 6 hours. Results are represented relative to the value obtained at the promoter after 12 hours of induction.


More Related
Audio
Live Player