Download

1 / 46
460 likes | 587 Views
Cold Front and Mountains A Doppler Radar View March 13- 15, 2009 Case Mark Pilon. Mar. 15, VVO 11.0 Doppler. 0330 UTC. 0400 UTC. 0430 UTC. Surface winds increase sharply between 04 and 05 UTC at Callaghan VOD. Note at this time upper level winds are actually decreasing in strength.

E N D
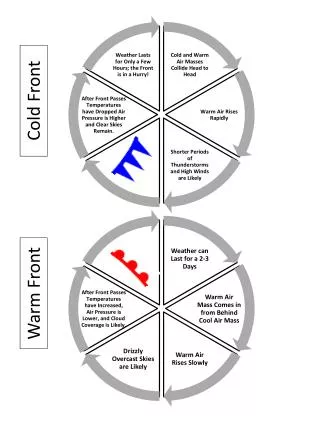
Cold Front and MountainsA Doppler Radar ViewMarch 13- 15, 2009 CaseMark Pilon
Mar. 15, VVO 11.0 Doppler 0330 UTC 0400 UTC 0430 UTC Surface winds increase sharply between 04 and 05 UTC at Callaghan VOD. Note at this time upper level winds are actually decreasing in strength. However winds are increasing in the low levels – this is evident near the origin of the radar where the beam is close to the ground. See next slide for low angle beam.
Mountain Weather Scale ~90 min Similar to Summer Convective Scale!
Mar. 15 VVO 2.0 Doppler This animation shows the low level winds increasing from about 6 m/s (darker blues) to over 12 m/s (purples) in the sea to sky valley
Threshold for Biathlon Thresholds for Jump
WSK-Whistler profiles • Yellow lines mark purple vs blue and red vs pink contours. • Note that: • winds are towards the radar from both 187 and 73 degrees in low levels. • Layering of winds is evident indicating fairly stable stratification
Area of heavier precipitation associated with front Red arrow marks approach of a front moving up the valley
Stronger winds are beginning to descend in the Callaghan to Squamish segment ahead of frontal feature.
Reaches Radar Approx 0410 UTC. Main area of precipitation gets “lost” as it goes over the radar
Total lead time – assuming forecaster notices feature right away: ~ 20 mins? At this time layer appears to be well mixed with fairly uniform winds – vertical stratification has disappeared.
Callaghan OAN Winds Feature reaches Whistler around 0430. No noticeable effect on the winds
Whistler Alpine stations show effects after 0500 UTC with more variability in speed and direction. In some of the data there seems to be an abrupt discontinuity in the trends shortly after 0500 UTC.
Why the hour difference between Callaghan and Whistler winds? • Passage of front marked beginning of a series of changes • Change in Whistler winds may have been affected by other factors associated with front • Front is not quite a sharp discontinuity in weather • Took over an hour for all of these changes to occur. • This is evident from the Doppler seen below
Changes in wind field take 40 mins to stabilize from 0400 UTC to 0440 UTC • lessening of precipitation coverage takes over one hour
Threshold for Biathlon Thresholds for Jump
Is there an enhanced flow or LLJ up the Valley? One has to be careful in interpreting these RHIs – a reduction in wind “strength” may actually be simply a shift in wind direction!
These high ridges parallel the wind and seem to block it and give a “V” notch pattern
Does the enhanced flow / jet impact winds / precipitation? • Was the wind event at the Callaghan due to a descending jet or enhanced flow? • In this case the airmass was not well mixed after the onset of winds. • Some of the strong wind events may be due to descending jets rather than mixing down of stronger winds.
Winds Diminish at VOD, smooth flow. LLJ very weak or moved away. Max winds above 2 km Strongest winds at VOD, note the turbulent flow. No vertical layering of winds evident. Max winds mixed down to surface. Note on the Whistler cross section at this time a couple of slides down that there must still be a stable layer of air trapped in the valley as winds remain stratified. Winds pick up at VOD, smooth flow, appearance of LLJ / lowering of winds aloft. Winds stregthen at VOD, smooth flow, LLJ below 1 km Light winds, smooth flow, max winds above 1 km
There is a big change in the appearance of the wind field after 22/23 UTC in the wake of the cold front – it is much more turbulent
Passage of front not clear from Doppler winds • Perhaps winds were so strong signal was lost. • Passage of front more evident in reflectivity. • Assumed to pass WSK 2300 and Whistler 2330 UTC.
In next set of slides effect of front is visible by reduction in intensity of precipitation.
March 17/06z – VOY 04G08 m/sMarch 17/07z – VOY 05G10 m/s Beiges here not evident on next slide. Jet is below 1 km
March 17/06z – VOY 04G08 m/sMarch 17/07z – VOY 05G10 m/s Note the presence of the v notch and the jet south of the jump. Though the winds appear lighter at the jump they are not. The cross section in the previous slide shows that the jet is tilting towards the bottom left as one goes lower in elevation.