Download
1 / 39
400 likes | 535 Views
This chapter explores continuous probability distributions, focusing on the uniform, normal, and exponential distributions. Continuous random variables can take any value within an interval, and this section explains how to calculate probabilities using density functions for each distribution type. It highlights key characteristics, expected values, variances, and practical examples such as salad plate filling weight and motor oil stock replenishing. Gain insights into how these distributions apply in statistical inference and real-world scenarios.

E N D
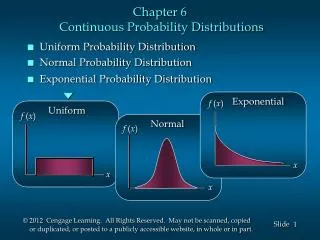
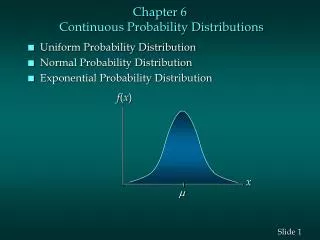
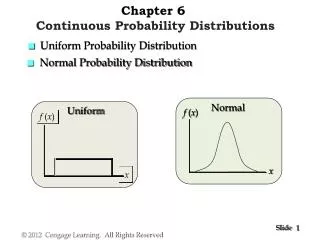
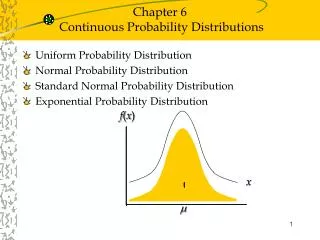
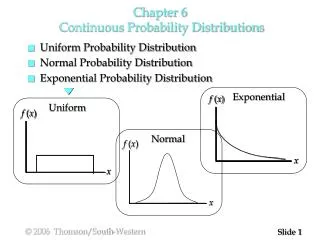
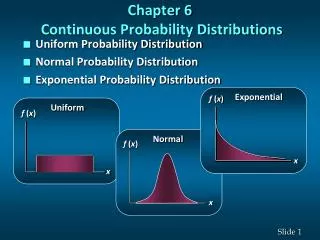
Exponential f (x) Uniform f (x) Normal f (x) x x x Chapter 6 Continuous Probability Distributions • Uniform Probability Distribution • Normal Probability Distribution • Exponential Probability Distribution
6.1 Continuous Probability Distributions • A continuous random variable can assume any value in an interval on the real line or in a collection of intervals. • It is not possible to talk about the probability of the random variable assuming a particular value. • Instead, we talk about the probability of the random variable assuming a value within a given interval.
Exponential f (x) Uniform f (x) Normal f (x) x x1 x2 x1 x2 x x1 x2 x x1 x2 Continuous Probability Distributions • The probability of the random variable assuming a value within some given interval from x1 to x2 is defined to be the area under the graph of the probability density function between x1and x2.
6.2 Uniform Probability Distribution • A random variable is uniformly distributed whenever the probability is proportional to the interval’s length. • The uniform probability density function is: f (x) = 1/(b – a) fora<x<b = 0 elsewhere where: a = smallest value the variable can assume b = largest value the variable can assume
Uniform Probability Distribution • Expected Value of x E(x) = (a + b)/2 • Variance of x Var(x) = (b - a)2/12
Uniform Probability Distribution • Example: Slater's Buffet Slater customers are charged for the amount of salad they take. Sampling suggests that the amount of salad taken is uniformly distributed between 5 ounces and 15 ounces.
Uniform Probability Distribution • Uniform Probability Density Function f(x) = 1/10 for 5 <x< 15 = 0 elsewhere where: x = salad plate filling weight
Uniform Probability Distribution • Expected Value of x • Variance of x E(x) = (a + b)/2 = (5 + 15)/2 = 10 Var(x) = (b - a)2/12 = (15 – 5)2/12 = 8.33
5 10 15 Uniform Probability Distribution • Uniform Probability Distribution for Salad Plate Filling Weight f(x) 1/10 x Salad Weight (oz.)
5 10 12 15 Uniform Probability Distribution What is the probability that a customer will take between 12 and 15 ounces of salad? f(x) P(12 < x < 15) = 1/10(3) = .3 1/10 x Salad Weight (oz.)
6.3 Normal Probability Distribution • The normal probability distribution is the most important distribution for describing a continuous random variable. • It is widely used in statistical inference.
Normal Probability Distribution • It has been used in a wide variety of applications: • Amounts • of rainfall Test scores
= mean = standard deviation = 3.14159 e = 2.71828 Normal Probability Distribution • Normal Probability Density Function where:
Normal Probability Distribution • Characteristics The distribution is symmetric; its skewness measure is zero. x
Normal Probability Distribution • Characteristics The entire family of normal probability distributions is defined by itsmeanμand its standard deviationσ. Standard Deviations x Meanm
Normal Probability Distribution • Characteristics The highest point on the normal curve is at the mean, which is also the median and mode. x
Normal Probability Distribution • Characteristics The mean can be any numerical value: negative, zero, or positive. x -10 0 20
Normal Probability Distribution • Characteristics The standard deviation determines the width of the curve: larger values result in wider, flatter curves. s= 15 s = 25 x
Normal Probability Distribution • Characteristics Probabilities for the normal random variable are given by areas under the curve. The total area under the curve is 1 (.5 to the left of the mean and .5 to the right). .5 .5 x
Normal Probability Distribution • Characteristics of values of a normal random variable are within of its mean. 68.26% +/- 1 standard deviation of values of a normal random variable are within of its mean. 95.44% +/- 2 standard deviations of values of a normal random variable are within of its mean. 99.72% +/- 3 standard deviations
99.72% 95.44% 68.26% Normal Probability Distribution • Characteristics x m m + 3s m – 3s m – 1s m + 1s m – 2s m + 2s
Standard Normal Probability Distribution A random variable having a normal distribution with a mean of 0 and a standard deviation of 1 is said to have a standard normal probability distribution.
Standard Normal Probability Distribution The letter z is used to designate the standard normal random variable. s = 1 z 0
Standard Normal Probability Distribution • Converting to the Standard Normal Distribution We can think of z as a measure of the number of standard deviations x is from μ.
Standard Normal Probability Distribution • Standard Normal Density Function where: z = (x –m)/s = 3.14159 e = 2.71828
Pep Zone 5w-20 Motor Oil Standard Normal Probability Distribution • Example: Pep Zone Pep Zone sells auto parts and supplies including a popular multi-grade motor oil. When the stock of this oil drops to 20 gallons, a replenishment order is placed.
Pep Zone 5w-20 Motor Oil Standard Normal Probability Distribution • Example: Pep Zone The store manager is concerned that sales are being lost due to stockouts while waiting for an order. It has been determined that demand during replenishment lead-time is normally distributed with a mean of 15 gallons and a standard deviation of 6 gallons. The manager would like to know the probability of a stockout, P(x > 20).
Pep Zone 5w-20 Motor Oil Standard Normal Probability Distribution • Solving for the Stockout Probability Step 1: Convert x to the standard normal distribution. z = (x -)/ = (20 - 15)/6 = .83 Step 2: Find the area under the standard normal curve to the left of z = .83.
Pep Zone 5w-20 Motor Oil Standard Normal Probability Distribution • Cumulative Probability Table for the Standard Normal Distribution P(z< .83)
Pep Zone 5w-20 Motor Oil Standard Normal Probability Distribution • Solving for the Stockout Probability Step 3: Compute the area under the standard normal curve to the right of z = .83. P(z > .83) = 1 – P(z< .83) = 1- .7967 = .2033 Probability of a stockout P(x > 20)
Pep Zone 5w-20 Motor Oil Standard Normal Probability Distribution • Solving for the Stockout Probability Area = 1 - .7967 = .2033 Area = .7967 z 0 .83
Pep Zone 5w-20 Motor Oil Standard Normal Probability Distribution • Standard Normal Probability Distribution If the manager of Pep Zone wants the probability of a stockout to be no more than .05, what should the reorder point be?
Pep Zone 5w-20 Motor Oil Standard Normal Probability Distribution • Solving for the Reorder Point Area = .9500 Area = .0500 z 0 z.05
Pep Zone 5w-20 Motor Oil Standard Normal Probability Distribution • Solving for the Reorder Point Step 1: Find the z-value that cuts off an area of .05 in the right tail of the standard normal distribution. We look up the complement of the tail area (1 - .05 = .95)
Pep Zone 5w-20 Motor Oil Standard Normal Probability Distribution • Solving for the Reorder Point Step 2: Convert z.05 to the corresponding value of x. x = μ + z.05 = 15 + 1.645(6) = 24.87 or 25 A reorder point of 25 gallons will place the probability of a stockout during leadtime at (slightly less than) .05.
Pep Zone 5w-20 Motor Oil Standard Normal Probability Distribution • Solving for the Reorder Point By raising the reorder point from 20 gallons to 25 gallons on hand, the probability of a stockout decreases from about .20 to .05. This is a significant decrease in the chance that Pep Zone will be out of stock and unable to meet a customer’s desire to make a purchase.
Normal Approximation of Binomial Probabilities • When the number of trials, n, becomes large, • evaluating the binomial probability function by • hand or with a calculator is difficult • The normal probability distribution provides an • easy-to-use approximation of binomial probabilities • where n > 20, np > 5, and n(1 - p) > 5.
Normal Approximation of Binomial Probabilities • Set μ= np • Add and subtract 0.5 (a continuity correction factor) because a continuous distribution is being used to approximate a discrete distribution. For example, P(x = 10) is approximated by P(9.5 <x< 10.5).