NASP IMDS
250 likes | 591 Views
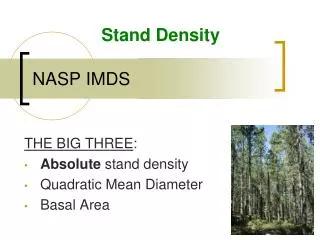
Stand Density. NASP IMDS. THE BIG THREE : Absolute stand density Quadratic Mean Diameter Basal Area. Graphical Guides. Density. Age. Size-Density Relationship.

NASP IMDS
E N D
Presentation Transcript
Stand Density NASP IMDS THE BIG THREE: Absolute stand density Quadratic Mean Diameter Basal Area
Density Age Size-Density Relationship • The predictable relationship between mean size of trees and their associated density in crowded (i.e., stem exclusion) populations
Boundary Line Examples (AKA: “-3/2 Power Law”) Log-log Scale
Stand Density Index • Stand Density Index (SDI) – Woodard paper • Reineke (1933) • Species-specific upper limit • Density when the stand has a standardized QMD • Calculated as:
Stand Density Index Values Suggested Maximum SDI by species and source. English units are number of10-inch trees per acre. Metric units are number of 25.4cm trees per hectare. Long, J. N. 1985. A pratical approach to density management. Forest Chronicle 61:23-37. Reineke, L. H. 1933. Perfecting a stand density index for even-aged forests. Journal of Agricultural Research 46(7):627-638. Schnur, G. L. 1937. Yield, stand, and volume tables for even-aged upland oak forests. USDA Technical Bulletin No. 560, 87p.
StockingCharts & Guides • Size vs. Density • Log-Log scale • SDI on the “third axis” • SDImax = 1000 Taylor Woods Level-of-Growing-Stock Study Flagstaff, AZ
Relative Density Index • Relative Density Index (RDI) • Basically the percent of maximum SDI • Communication across species (species have maximums) • Intuitive feel • Magic thresholds for stand dynamics • 0.15 - 0.30 for crown closure • 0.40 for scheduling of growing space thinnings • 0.55 for entering “the zone of imminent competition” • 0.80 for certain mortality agents
Density Management Diagrams • Packaging the concepts together • Simple management tool • Old GSL “boat” diagrams • Additional information on the diagrams
150 6” (800 TPA, 5.1”) 4” 340 TPA 653 TPA INTERPRETING CHANGES
Density Effects on Growth PER ACRE
Density Effects on Growth PER ACRE
DENSITY EFFECTS ON GROWTH • Tree vigor and mortality rates • Plasticity of the trees – think about this at “Hoskins” LOGS study (chapter 7) • Live Crown Ratio and “canopy depth” • Crown Radius (branch length/size) and crown closure • Height:Diameter and “stability” (e.g., in wind and snow) • Wood utilization products; size and quality • Understory richness, diversity and abundance • Net Primary Productivity distribution • Ecosystem “stuff”
OTHER DENSITY MEASURES • CURTIS’ “RELATIVE DENSITY” RD = BA √QMD • RELATIVE or “AVERAGE SPACING”: (can be relative to heights, as well) • TREE-AREA RATIO: area occupied by tree crowns per unit land area; TA can be estimated from D or D2 • CROWN COMPETITION FACTOR; TA relative to open grown trees
UNEVEN-AGED structures? • SDI calculated by diameter class from a stand table • BUT don’t stretch too far…why?