Download
1 / 15
150 likes | 290 Views
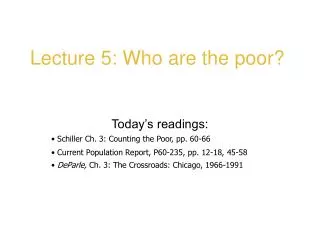
Lecture 5: Who are the poor?. Today’s readings: Schiller Ch. 3: Counting the Poor, pp. 60-66 Current Population Report, P60-235, pp. 12-18, 45-58 DeParle, Ch. 3: The Crossroads: Chicago, 1966-1991. Today’s Topics. Calculating poverty rates Who are America’s poor?

E N D
Lecture 5: Who are the poor? Today’s readings: Schiller Ch. 3: Counting the Poor, pp. 60-66 Current Population Report, P60-235, pp. 12-18, 45-58 DeParle, Ch. 3: The Crossroads: Chicago, 1966-1991
Today’sTopics • Calculating poverty rates • Who are America’s poor? • What we learn from studying poverty spells--the dynamics of poverty
Calculating Poverty Rates(People in Thousands,Table B-1, P60-235)
Over and Under-representation Among the Poor • Which racial groups are over-represented among the poor? Which are under-represented? • Compare group’s poverty rate to overall poverty rate. • If PRG > PRall, Group is over-represented. • If PRG < PRall, Group is under-represented. • Compare columns (3) and (6) by row. • Conclusions: • Blacks and Hispanics are over-represented. • Whites are under-represented.
Who are America’s Poor?Snapshots from the CPR Use CPR P60-235 to answer the following questions for 2007: • Which age group has the highest poverty rates? • Which family type has the highest poverty rates? • Is the risk of poverty greater for noncitizens or native-born Americans? • Rank the following racial categories from highest poverty rate to lowest poverty rate: American Indian/Alaskan Native, Asian, Black, Hispanic, White.
Who are America’s Poor? Where are the poor most likely to live? • Northeast, Midwest, South, or West? • Central cities, suburbs, or outside metropolitan areas?
Who are America’s Poor? • How much greater is the risk of poverty for children living their mothers only than for children who live with married couples? • On average, how much income was needed to pull poor families out of poverty in 2007? • True or False: A majority of poor adults do not work.
Poverty Spells Mary Jo Bane and David Ellwood,“Slipping into and Out of Poverty: The Dynamics of Spells,” The Journal of Human Resources, Vol. 21, No. 1 (Winter, 1986), 1-23. (Source for the following 6 slides.) • What are poverty spells? • Why study poverty spells? • What is the distribution of poverty spells by length? • How do poverty spells begin? • How do poverty spells end? • What does the analysis of poverty spells tell us about welfare dependency?
Bane and Ellwood “Slipping Into and Out of Poverty” • What are poverty spells? • Continuous periods during which income falls below the poverty line. • Why study poverty spells? • Because we need to distinguish between the larger population of people who are ever poor, and those who are poor at a point in time if we are the understand the effects of culture, dependency, and the allocation of assistance.
Poverty Spells: Bane and EllwoodDistribution of Completed Spells of Poverty
Poverty Spells: Bane and EllwoodDistribution of Completed and Uncompleted Spells of Poverty
Bane and EllwoodConclusions of “Slipping Into and Out of Poverty” • Most of those who ever become poor will have a short stay in poverty. • The majority of those who are poor at a given time will have very long spells of poverty. • Most people use aid programs briefly. • The bulk of aid goes to a small group that has very long stays in poverty. • Changes in family structure and life cycle events explain nearly one-half of spell beginnings. • A fall in the head’s earnings explain a small minority of beginnings. • Increase earnings of all household members is the primary route out of poverty. • The poverty population is extremely heterogeneous.
Poverty Spells • Consequences of Bane and Ellwood’s Work • Survey of Income and Program Participation (SIPP)--a longitudinal survey that allow the analyst to observe how the status of the same group of people changes over time; ie., to study the dynamics of poverty. http://www.census.gov/hhes/www/poverty/newguidance.html#sipphighlight • Methodology applied to spells of welfare receipt