Download
1 / 46
500 likes | 684 Views
The Local Analysis and Prediction System (LAPS). Local Analysis and Prediction Branch NOAA Forecast Systems Laboratory Paul Schultz. LAPS Mission. A system designed to: Exploit all available data sources Create analysis grids for nowcasting and “generic” model intialization

E N D
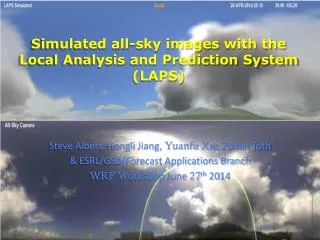
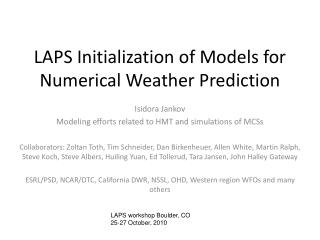
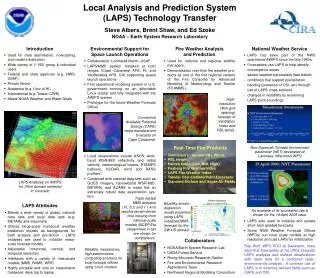
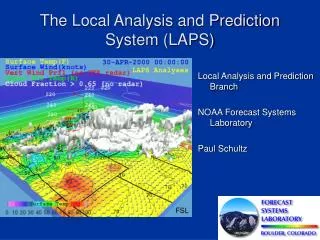
The Local Analysis and Prediction System (LAPS) Local Analysis and Prediction Branch NOAA Forecast Systems Laboratory Paul Schultz
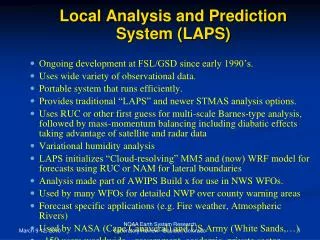
LAPS Mission A system designed to: • Exploit all available data sources • Create analysis grids for nowcasting and “generic” model intialization • Build products for specific forecast applications • Provide reliable forecast guidance • Use advanced display technology …All within a local weather office, forward site, or in fully deployed mode
The LAPS team • John McGinley, branch chief, variational methods • Paul Schultz, project manager, modeler, your speaker today • Brent Shaw, modeler • Steve Albers, cloud analysis, temp/wind analysis • Dan Birkenheuer, humidity analysis • John Smart, everything
Surface RAOB Sat ACARS GPS Radar(Vr) Profilers Radar(Z) Sat Aircraft METAR Data Ingest/Quality Control Data Fusion Cloud Analysis NWP FG T, F T, F, p, u, v, w, RH 3DVAR Dynamic Constraint wc Forecaster Adjust for Model: Hydrometeor Concen. Saturation Condition Constraints: Mass Continuity u/v Time Tendencies Background Error Observation Error T, F, p, u, v, RH qc qi, qr qs, qg LAPSPREP Isobaric Output Native Output NWP System LAPSPOST LBC National NWP LSM IC LAPS Diabatic Initialization
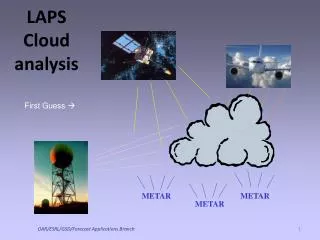
Cloud Analysis Scheme • Uses satellite Vis and IR • Aircraft observations • Surface observations • Radar • Interpolates cloud obs to grid with SCM • Cloud feeds back into water vapor analysis
LAPS Dynamic Balance Adjustment FH FL Q > 0
“Hot Started” forecasts 00Hr Fcst, Valid 28 Mar 01/00Z 01Hr Fcst, Valid 28 Mar 01/01Z Cloud fields realistically maintained
Initialization 5 min forecast Illustration Hot Start Cloud insertion Cloud liquid (shaded), vertical velocity (contours) and cross-section streamlines for analyses (right) and 5-min forecasts (left). The top pair shows LAPS hot-start DI with upward vertical motions where clouds are diagnosed and properly sustained cloud and vertical motions in the forecast; the bottom pair demonstrates the artificial downdraft that usually results from simply injecting cloud liquid into a model initialization without supporting updrafts or saturation. Note that cloud liquid at the top of the updraft shown in the hot-started forecast (above right) has converted to cloud ice.
Current LAPS Projects • Fire Weather Support • Highway Weather Support – Ensemble Modeling • Space Center Support System - KSC and Vandenberg • Army Paradrop Project - laptop deployment • Taiwan Central Weather Bureau
Space Launch Operations Support • USAF Space Launch Facilities • Vandenberg and Cape Canaveral • LAPS and MM5 • 10, 3.3, 1.1 km nests • Critical for launch and range safety weather forecasting • Utilizes local towers, profilers, miniSODARs, etc. • Operational “firsts” • AWIPS Integration • Linux cluster modeling
Cape Canaveral 6-hour QPF on 1-km Grid and Radar Verification9 Feb 04
PADS System Background Typical Airdrop Events Treated in PADS Canopy- Opening/ Deceleration CARP Green Light Drop Sonde Roll-Out DESCENT TRAJECTORY Fall or Glide Trajectory Model + 3D Atmospheric Wind/Density Field Assim Time Complex 3D Atmospheric Flow over/through Mountainous Terrain Ballistic System or Guided System (Corrects to Planned Descent Trajectory)
Current PADS Features PADS Fly-Away Kit: Flight-Certified for the C-130 and the C-17
Results: Intermediate Altitude C-130 Airdrops (10,000-15,000 ft)
Local model ensembles • Basis: Multiple equally-skillful forecasts can be combined into a single forecast that is better than any one of the ensemble members • FSL’s first application: a road weather prediction project
FWHA Road Maintenance Decision Support Project- Iowa 2003, 2004 RWIS tower, I-35 south of Ames
FSL model data CRREL Road temp/chemical module MIT/LL rules of treatment practice GUI in the field NCAR Road Weather Forecast System Maintenance Decision Support System • Sponsored by FHWA • Cooperative 5-yr project with NCAR/RAP, CRREL, MIT/LL • Help snowplow garage supervisors decide when/where to send trucks, chemical treatments • FSL: produce supplemental model runs and transmit them to NCAR
Forecast point status display Place cursor over a forecast point
Bulk statisticsState variables, 12-hr forecastsFeb 1 – Apr 8, 2003
A closer look 9 pm model runs, verifying only Iowa stations, entire expt
MM5-Eta WRF-AVN MM5-AVN RAMS-Eta RAMS-AVN WRF-Eta
Conclusions from 2003 MDSS demonstration • Lateral bounds not useful for adding diversity for this application • Good diversity • Models: MM5 and WRF • Initialization data • Considerable value to the client in earliest hours of forecasts (hot start)
6 model runs 4 sets per day (i.e., every 6 hrs) 27-hr forecasts 3-hr temporal resolution 2 model runs 24 sets per day (i.e., every hour) 15-hr forecasts 1-hr temporal resolution Juggling act 2003 2004
Loops of the two different models initialized at the same time
Bulk statisticsState variables, 12-hr forecastsDec 29 – Mar 19, 2004
Diurnal trend in temperature forecast errors Midnight model runs
Advances in numerical weather prediction via MDSS • Practical diabatic initialization • Models have useful, skillful precipitation forecasts in first few hours • Reduced latency • MDSS: forecasts available ~1 h after data valid time • NCEP: forecasts available ~3 h after data valid time • Increased frequency • MDSS: updates every hour • NCEP: updates every six hours
Cycle :00 :48 :20 :35
Ensemble applications • Ensembles produce probability forecasts that can be more reliable • Probabilistic output can be input into economic cost/lost models • Customers get a “yes-no” forecast based upon skill and spread of ensemble
Reflectivity Probabilities for Aviation • The forecast-area specificity decreases as forecast lead times increases. • Example probability forecast of level 3 or greater reflectivity for various forecast lead times are shown. The valid time is the same for all images. The images illustrate the expected degradation in forecast-area specificity with time. 0-1 hr 1-2 hr 3-4 hr 2-3 hr • Probability of level 3 echo with green 10%, yellow 30% and red 60%. Slide courtesy C. Mueller, NCAR/RAP
Yes or no Use of Mesoscale Model Ensembles - Transport Weather and Fire Weather Forecast for Springfield, MO: 79% chance of 1 mm 36% chance of 10 mm 100% chance T > 32F Probabability generator Economic cost/loss models
Ensemble-Generated 1-Hr Probability of Smoke Concentration > 60% > 20%
Ensemble-Generated 2-Hr Probability of Smoke Concentration > 60% > 20%
Ensemble-Generated 3-Hr Probability of Smoke Concentration > 60% > 20%