Download
1 / 16
170 likes | 318 Views
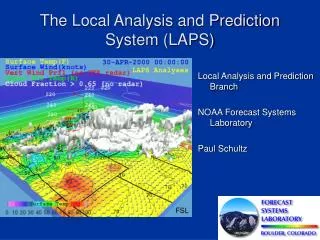
HAROKOPIO UNIVERSITY OF ATHENS DEPARTMENT OF GEOGRAPHY ATMOSPHERE AND CLIMATE DYNAMICS GROUP (ACDG) http://meteoclima.gr. Statistical evaluation of the Local Analysis and Prediction System over Greece. Katsafados P. 1 , A. Papadopoulos 2 , K. Lagouvardos 3 , V. Kotroni 3 ,

E N D
HAROKOPIO UNIVERSITY OF ATHENS DEPARTMENT OF GEOGRAPHY ATMOSPHERE AND CLIMATE DYNAMICS GROUP (ACDG) http://meteoclima.gr Statistical evaluation of theLocal Analysis and Prediction System over Greece Katsafados P.1, A. Papadopoulos2 , K. Lagouvardos3, V. Kotroni3, E. Mavromatidis1 , and I. Pytharoulis4 1 Dpt of Geography, Harokopio University of Athens, Greece 2Inst. of Inland Water, Hellenic Center for Marine Research, Greece 3Inst. of Environmental Research and Sustainable Development, National Observatory of Athens, Greece 4Dpt of Geology, Aristotle University of Thessaloniki, Greece October 2012
ATMOSPHERE AND CLIMATE DYNAMICS GROUP-2012 LAPS in Greece. A historical review • 1999: First installation at the Hellenic National Met-Service in the framework of NIREAS project • 2004: Major LAPS upgrade for supporting the Olympic games in Athens • 2006: Installation in the Hellenic Centre for Marine Research (HCMR) for upgrading the POSEIDON forecasting system • POSEIDON became operational at HCMR in October 1999 • A major upgrade of the system was recently implemented in the POSEIDON-II EU-funded project (2005-2008) • The aim was to enhance the forecasting skill of the system through advanced numerical techniques for assimilating available observations in order to achieve optimum initialization of the atmospheric model • To this end, LAPS has been implemented as an integral component of the POSEIDON system
ATMOSPHERE AND CLIMATE DYNAMICS GROUP-2012 LAPS characteristics & configuration • The domain covers the Mediterranean, the Black Seaand the Eastern Atlantic Ocean • Domain horizontal resolution: 15x15 km • Vertical discrimination 22levels up to50mb • Gridded background data from GFS/NCEP with time increment of 3 hours • Ingestion ofmetarsevery 1 hour, synops every 3 hoursandraobs every 12 hours • LAPS outputs are hourly analyses in netcdf and grib format • Required time of operation is about 15 min • Production of initial conditions for various atmospheric models like WRF, RAMS, Eta etc
ATMOSPHERE AND CLIMATE DYNAMICS GROUP-2012 LAPS data ingestion • GFS/NCEP background gridded data based on00:00 και 12:00 UTC forecast cycles • LAPS operational cycle every 1 hour • Production of 24 analyses on daily basis • Ingestion of ~700 surface and~30 upper air observations per analysis cycle
ATMOSPHERE AND CLIMATE DYNAMICS GROUP-2012 LAPS operational suite 00 UTC GFS data12 UTC GFS data metars metars metars metars metars metars metars metars metars metars metars metars metars metars metars metars synops synops metars synops synops synops metars synops synops synops metars metars metars metars metars metars 18 raobs raobs 00 01 02 03 04 05 06 07 08 09 10 11 12 13 14 15 16 17 18 19 20 21 22 23 00 UTC ~ 30 raobs ~ 60 synops ~ 650 metars LAPS analysis POSEIDON initialization
BC Local Analysis Prediction System METARS + SYNOPS + RAOBS IC POSEIDON-LAPS setup Analysis Products ATMOSPHERE AND CLIMATE DYNAMICS GROUP-2012 Two Sets of operational procedures POSEIDON-GFS setup GFS Analysis & Forecast 0.5ox0.5o IC BC GFS Fields Background 5 km Forecast Products +120 hrs
ATMOSPHERE AND CLIMATE DYNAMICS GROUP-2012 POSEIDON-GFS vs POSEIDON-LAPS • The two sets of operational procedures evaluated against surface observations from the end of 2007 to the mid of 2009(Papadopoulos et al., 2009, 11thPlinius Conf.). POSEIDON initializations with LAPS do not increase the model forecasting skill to the expected level
ATMOSPHERE AND CLIMATE DYNAMICS GROUP-2012 LAPS evaluation • LAPS evaluated against a number of independent observations over Greece • The main objective is to examine the dependence of LAPS analyses to their background forcing and to investigate the LAPS sensitivity on the surface and upper air observations • The observational data were used to verify and compare LAPS outputs at the synoptic hours (00, 06, 12 and 18 UTC) • The network is operated by the National Observatory of Athens (NOA) and includes 86 conventional surface stations • The most of the stations are located under the 500 m AGL while only 8 stations are over 1000 m
ATMOSPHERE AND CLIMATE DYNAMICS GROUP-2012 The evaluation methodology • Period of evaluation: 3 consecutive years (2009-2010-2011) • The evaluation methodology was based on the point-to-point comparison between the LAPS-generated variables and the independent surface observations that were not assimilated in LAPS • Statistical scores for the continuous variables: BIAS and Root Mean Square Error (RMSE) • F: LAPS-generated variables (analyses) • O: observed value • N: sample • LAPS surface state variables of evaluation are: air temperature at 2 m, mean sea level pressure, relative humidity at 2 m and wind speed at 10 m
ATMOSPHERE AND CLIMATE DYNAMICS GROUP-2012 Statistical analysis of the temperature • The box plots display the median (solid line), and the 25th, and 75th percentiles of the RMSE and BIAS values • The range of the RMSE is relatively small • BIAS indicate a slight and a more widespread prevailing underestimation • RMSE ranges from 2.2°C-2.6° C over the analysis hours • Small daily ranges for both RMSE and BIAS
ATMOSPHERE AND CLIMATE DYNAMICS GROUP-2012 Geographical distribution of the analysis error for the temperature
ATMOSPHERE AND CLIMATE DYNAMICS GROUP-2012 Statistical analysis of the relative humidity • BIAS scores indicate an underestimation (up to 2%) which is turned to slight overestimation at the noon hours • RMSE remains almost constant around 10.3-11.1 % over the analysis hours and with limited spread of values
ATMOSPHERE AND CLIMATE DYNAMICS GROUP-2012 Statistical analysis of the MSLP • Systematic overestimation of MSLP, more prominent during the evening hours • RMSE ranges from 1.5-1.8 hPa over the analysis hours • Some stations contribute with significant analysis errors (2-3 hPa) • Stations at mountainous areas exhibited large analysis errors
ATMOSPHERE AND CLIMATE DYNAMICS GROUP-2012 Statistical analysis of the wind speed • Only few stations (6) have installed anemometer sensors at 10m AGL • 34 stations are at 5 m and the rest are lying between 2-4 m (the records are then estimated at 10 m using the wind profile power law) • The systematic overestimation of the wind speed is combined with an analysis error of 2.6-3.0 m/s • Wide range of RMSE among the stations
ATMOSPHERE AND CLIMATE DYNAMICS GROUP-2012 Geographical distribution of the analysis error for the wind speed • Significant analysis errors are located at • areas with steep orography • islands with complex physiographic characteristics which are not adequately resolve in LAPS domain
ATMOSPHERE AND CLIMATE DYNAMICS GROUP-2012 Concluding Remarks • LAPS outputs matched trends in independent temperature, relative humidity, mean sea level pressure and wind speed observations spatially and temporally • In more details, temperature errors were generally ~2.4C, relative humidity discrepancies were ~11%, while mean sea level pressure and wind speed errors were < 2 hPa and < 3 ms-1 respectively • The above scores characterize the performance of LAPS and they are in agreement with the results from similar studies (Hiemstra et al., 2006) but they are also close to the scores of the GFS model (Yu and Gerald, 2004) • The background fields (GFS) seem to play a key role in the quality of the produced analyses given this LAPS configuration