CPOD.exe … start here
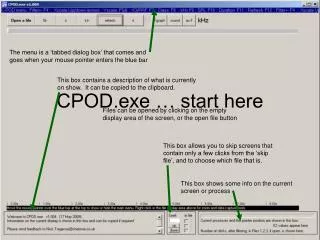
CPOD.exe … start here. The menu is a ‘tabbed dialog box’ that comes and goes when your mouse pointer enters the blue bar. This box contains a description of what is currently on show. It can be copied to the clipboard.

CPOD.exe … start here
E N D
Presentation Transcript
CPOD.exe … start here The menu is a ‘tabbed dialog box’ that comes and goes when your mouse pointer enters the blue bar This box contains a description of what is currently on show. It can be copied to the clipboard. Files can be opened by clicking on the empty display area of the screen, or the open file button This box allows you to skip screens that contain only a few clicks from the ‘skip file’, and to choose which file that is. This box shows some info on the current screen or process
Two files are open ….. This one is a CP3 file. It contains only those clicks from a CP1 file that have been found to be in trains. This one is a .CP1 file. It contains the ‘raw’ data that came from the C-POD. It is the source file for the CP3 file above, but it can be a file from another POD. The display is showing the maximum peak-to-peak pressure of each click as a vertical line that is coloured to show the frequency of the click.
Clicking the graphics area also refreshes the graphics Fast forward. Repeat to go faster. ESC to stop. Show from start Move on (F1) You can open up to three files. These PODs were close together and started in synchrony. The time difference between PODs can be a fraction of a second, depending on how accurately you timed the release of the setup button. Clock drift is less than a second per month. In high resolution displays each line represents all clicks within 1 pixel – which spans 5ms in this case
Here the display is showing sound pressure levels. The Xaxis is at 20microseconds per screen pixel. At this high resolution you see multiple replicates of the click. These come from multi-path propagation – reflection and refraction that create longer paths, allowing progressive absorption of higher frequencies and some more obscure processes. The colour of each bar represents the pitch/frequency of the click. The width shows the duration. Actually the C-POD has no idea of clicks – it logs ‘tones’ – periods of time when marine noise has a distinct dominant frequency in the range 20 – 160khz even if there is no spike of intensity. Dolphin clicks typically show a spread of frequencies in the multipath replicates that follow the first loud click, while porpoise clicks show a far smaller spread.
The menu is frightening but it only wants to help You can choose to view other measures of each click. And you can change the X and Y scales You can also filter out some clicks to leave the ones that interest you
File 1 is lowest on the screen and in this list Deployment information can be amended, but beware: File 1 info goes into all. You can also create a new shorter file from a selected period of time. Make the selection using the right-click menu on the file display
These little lines at the top show the angle of the POD to vertical. They are white if it was logging, red if it was asleep. Low time resolution displays show counts of clicks. Here they are counted in train quality class bins. The colour coding is shown here Here you have about 24 hours of data. To zoom in put your mouse pointer over it and press the down arrow or right-click and select ‘zoom in’ from the pop-up menu.
Zooming-in expanded the time scale so the data previously at the mouse pointer position is now in the centre of the screen. Do it repeatedly and you go from counts of clicks to viewing individual clicks.
The CP3 file is showing the frequency of the train clicks, while the raw data in the source CP1 file shows the wide spread of frequencies received You can also zoom using the Files – View page of the menu – it’s quicker for large steps. Right/left arrow keys allow you to move earlier or later from the mouse pointer position.
If the mouse pointer is in the black area of the screen F keys, or the parameters list on the Files page, will show different parameters and F5 and F6 will rescale the Y axis.
Reading data from the SD card Warning: some PC card readers don’t work on all SD cards, but the USB reader provided will work. Follow steps 1 to 4 … The file name will be: ‘Location date PODn fileN.CP1’ ‘fileN’ indicates N files from one card. The deployment data are very important, don’t skip them!
Train identification, the light at the end of the tunnel, has arrived and is described in the Powerpoint ‘CPOD train filter’
Exporting your data Set any filters on the files and display page first Put the pointer over the buttons for more info and report any problems to nick@chelonia.co.uk
Qu i ck ana l ys i s The quick analysis page is useful in building up a picture of the general character of the data. Here the filter is set to dolphins, and the profiles show a broad spread of frequencies from mostly short clicks . Now the filter is set to porpoises, and the profiles show the expected changes … always encouraging …
Endpoints Endpoints define the ends of a selection that you can analyse, export from, or turn into a separate file. Endpoints are on minute boundaries, not in between. To set an endpoint view the file at 100ms or smaller time units and right click in the minute you wish to include as the end. Choose Set selection start, or Set selection end. If you do both in the same minute you get a selection of that minute only. If you only set one end the other end of the file is used.
Other help powerpoints include: ‘things you see in the data’ ‘train filter’ ‘exporting data’ ‘displays – the small print’ ‘calibration’ Please reports faults and short-comings – it’s hard to see them when you’re too close to it! nick@chelonia.co.uk the end Chelonia Limited