Download
1 / 17
170 likes | 489 Views
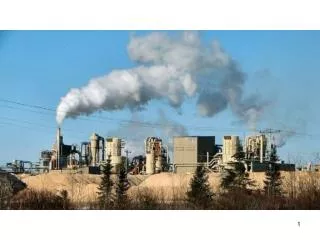
Ecotoxicology. Transport of contaminants. The transport of contaminants in the atmosphere takes place:. Globally. Large-scale:. > 1000 km. Meso-scale:. 10 - 1000 km. Micro-scale:. < 10 km. Boundary layer →. tropopause:. > 5 days. Whole tropospheric hemisphere :. > 1 month.

E N D
Ecotoxicology Transport of contaminants
The transport of contaminants in the atmosphere takes place: Globally Large-scale: > 1000 km Meso-scale: 10 - 1000 km Micro-scale: < 10 km
Boundary layer → tropopause: > 5 days Whole tropospheric hemisphere: > 1 month Global troposphere: > 2 years → Troposphere > 10 years Stratosphere: The dispersal of chemicals is a function of their atmospheric lifetime Examples NO ~ 1 day) ( 2 - only small exchange to the free tropopause Aerosol from Chernobyl ( ~ 1 month) - spreading to the whole Northern hemisphere Metan ( ~ 4 years) - mixing between both hemispheres Chlorfluorocarbon (CFC) ( ~ 100 years) - transport to the stratosphere
The global transport Hadley circulation South Equator North
Typical forms and sizes of trace metals in aquatic systems Soluble Colloidal Particulate Size---------------- 1 nm ------------------10 nm ----------------------100 nm ----------------1000 nm----------
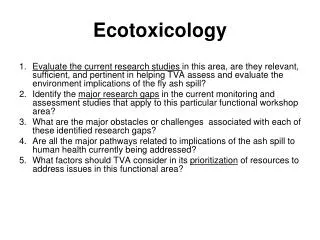
Concentration of chromium in the River Thames as a function of flow rate Dissolved Suspended 15 12 9 Concentration of Cr µg / l 6 3 50 100 150 200 250 Average flow (m3 s-1) Nitrate Phosphor
Wind + Coriolis force Thermic boundary layer
Atmosphere-land surface exchange 1 = = + + R r r r a b c Vg Dry deposition: particles and gases Wet deposition: Rainfall and fog Flux to surface = Vg • atmospheric concentration at 1 m Vg = deposition velocity Flux to surface = Vg Atmospheric concentration at 1 m Resistance to deposition = • ra : aerodynamic resistance to within 1-2 mm of the surface • rb : the resistance of the individual roughness elements in • the boundary layer (ca 1 mm) • - rc : the resistance of the surface itself to take-up of the gas
Deposition velocity of particles depends on their size 0.001-0.1 µm : Vg high (high diffusivity – like gasses) 0.01-1.0 µm : Vg small (atmospheric lifetime: 7-30 days) 1.0-100 µm : Vg high (heavy)
Washout from the atmosphere Concentration in rain (mg/kg) Washout factor W = Concentration in in air (mg/kg) W(drops) = 200 -1000 Air: microgram/m3 (1 m3 air weighs 1,2 kg) Rain: mg/l
1 1 1 = + a K k Hk ( T ) W W a The flux between air and sea H = solubility of gas K = constant α = the gas’ coefficient of absorption P = partial pressure of the gas Henry’s law: H=K·α·P Cair· H-1 = Cwater : equilibrium (H-1 Henry’s law constant) Cair· H-1 > Cwater : net transport air water Cair· H-1 < Cwater: net transport water air If: ΔC = Cair · H-1 – Cwater The transport of material is: F = K(T)W · ΔC (K(T)W : ”transfer velocity”) where kw and ka are the individual transfer velocities for gasses in water and air
Air – sea transfer velocity for CO2 Points: Experimental data Line: Calculated
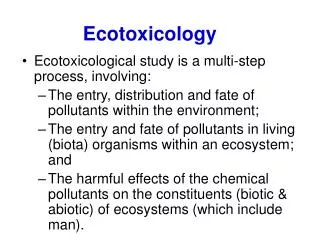
Water – sediment exchange Dissolved Suspended Sediment Water - suspended Concentration in solid phase material (mg/kg) = Distribution coefficient K d Concentration in dissolved phase (mg/kg) • Water – sediment • less efficient due to limited extent of contact • Suspended – sediment (sedimentation) • most important for the removal of contaminants from the water • Sedimentation rates are expressed as the rate of bottom increase • oceans : mm / 1000 years • lakes, estuaries : cm / year
dC = - + + Net flux F P ( D UC U C ) = 0 z S S dz Vand – sediment fluxe Sedimentation Exchange of pore water Physical mixing of sediment Upward flow of pore water Hydrostatic pressure P : Porosity (volume fraction occupied by water) D : Diffusion coefficient C : Concentration in solution CS: concentration in solids U : rate of pore water advection US : Sedimentation rate z : Vertical distance
Oxic zone Fe2O3 MnO2 Oxic Fe+++ Fe++ Mn++++ Mn++ Anoxic zone Anoxic Redox-active compounds Example: Ion and Manganese Bound to sediment Dissolved in pore water
Lead concentration in ice core from Greenland Atmospheric CO2-concentration measured in Hawaii (1950-1988)