Download
1 / 33
340 likes | 477 Views
Modeling environmental impacts of engineered nanomaterials : the value of “generic models” of individual organisms Roger M. Nisbet University of California, Santa Barbara.

E N D
Modeling environmental impacts of engineered nanomaterials: the value of “generic models” of individual organisms Roger M. Nisbet University of California, Santa Barbara Work with: Tin Klanjscek, Shannon Hanna, Trish Holden, Ben Martin, Ed McCauley, Bob Miller, Erik Muller, John Priester, Louise Stevenson, and many others Funding: US Environmental Protection Agency and National Science Foundation (through UC CEIN).
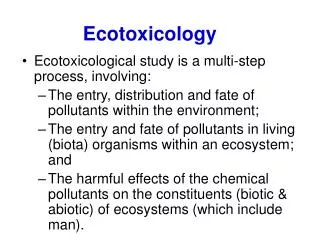
The need for theory in ecotoxicology • Contaminants impact individual organisms, populations, communities and ecosystems. • Contaminants are one component of environmental stress, that typically acts simultaneously with others (e.g. temperature, pH, food availability……….) • Gereraltheory is required because testing cannot match rate of introduction of new chemicals: • - 75,000+ chemicals registered for commercial use in US • - less than 1000 have undergone complete toxicity testing • - overwhelming costs of tests ($2-$4 million for in vivo studies)
The need for theory in ecotoxicology • Contaminantsimpact individual organisms, populations, communities and ecosystems. • Contaminants are one component of environmental stress, that typically acts simultaneously with others (e.g. temperature, pH, food availability……….) • Biology-based theory is required because testing cannot match rate of introduction of new chemicals: • - 75,000+ chemicals registered for commercial use in US • - less than 1000 have undergone complete toxicity testing • - overwhelming costs of tests ($2-$4 million for in vivo studies) • Dynamics of budgets of energy and elemental matter should be a component of this theory. • Kooijman’sDEB theoryoffers a powerful framework for this.
Definition • Engineered nanomaterial (ENM) consists of intentionally produced particles with a characteristic dimension between 1 and 100nm and possessing properties that are not shared by non-nanoscale particles with the same chemical composition” • Examples • - metal oxides – TiO2 and ZnO, (sunscreeen);Ag (antibacterial) • Quantum Dots (electronics) • Properties • - Size and shape dependent due to: large surface/volume • Often manufactured with coatings • Ecological/environmental impact? • May impact biogeochemical fluxes (nutrient cycling) • Toxicity (e.g designed for antibacterial/antifungal properties) Nanotechnology has made the challenge tougher
Information on potential ENM hazard 1000’s/year few/year 10,000’s/day 100,000’s/day 100’s/year High Throughput Bacterial, Cellular, Yeast, Embryo or Molecular Screening Expensive in vivo testing and ecological experiments Challenge for theorists: to use information from molecular and cellular studies to prioritize, guide design, and interpret ecological studies
Dynamic Energy Budget (DEB) Models Organism Growth Development Reproduction Survival Metabolic Products Resources DEB model equations describe the kinetics of the “reactor” that converts resources into “products”
Feces JEA Maturity Maintenance 1- Maturity or Reproduction MH MER Kooijman’s “standard” DEB model Food X ME Reserve JEC Mobilization k somatic maintenance growth MV
Kooijman’s “standard” DEB model* S.A.L.M. Kooijman (2010) Dynamic Energy Budget models for metabolic organization. Cambridge University Press. T. Sousa et al (2010)., Philosophical Transactions of the Royal Society B, 365:3413-3428.
Kooijman’s “standard” DEB model equations COLLECTION OF MESSY ODEs
Dynamics of structured populations • Environment: E-statevariables - experienced by all organisms - Resources - Toxicants - Metabolic products • Individual Organism: i-state variables - DEB state variables – ODEs in previous slides • Population dynamics: p-state variables – Book-keeping - population size, age structure, distribution of i-state variables - many mathematical representations possible (IBMs, PDEs, IDEs etc.) - special assumption (ontogenetic symmetry) yields ODEs Population modeling involves assumptions on interactions of individuals and their environment
Messages from some UC CEIN Projects • Phytoplankton I. Ontogeny symmetry assumed.Suborganismal and population properties consistent • 2) Phytoplankton II. Metabolic products important • Algal-produced compounds mitigate toxicity. • Bacteria. Metabolic products important. • Suborganismal data can help model selection. • 4) Individual Population projection for mussels. • Ontogeny asymmetry. • Population response more sensitive than individual • response • 5) Phytoplankton-zooplankton interactions. Ontogeny important and metabolic products important?
Kooijman’s “standard” DEB model* S.A.L.M. Kooijman (2010) Dynamic Energy Budget models for metabolic organization. Cambridge University Press. T. Sousa et al (2010)., Philosophical Transactions of the Royal Socitey B, 365:3413-3428.
Marine phytoplankton population growth* • Study of 4 phytoplankton species exposed to TiO2 and ZnO particles • No effect with TiO2 • ZnO effect probably due to Zn2+ Toxicity described by two quantities (NEC and one other) * R.J. Miller et al. (2010) Environmental Science & Technology44: 7329–7334
Marine phytoplankton population growth* • Study of 4 phytoplankton species exposed to TiO2 and ZnO particles • No effect with TiO2 • ZnO effect probably due to Zn2+ Toxicity described by two quantities (NEC and one other) DEB model * R.J. Miller et al. (2010) Environmental Science & Technolgy44: 7329–7334
Marine phytoplankton population growth* • Study of 4 phytoplankton species exposed to TiO2 and ZnO particles • No effect with TiO2 • ZnO effect probably due to Zn2+ Toxicity described by two quantities (NEC and one other) DEB model * R.J. Miller et al. (2010) Environmental Science & Technology44: 7329–7334
Marine phytoplankton population growth* Isochrysis galbana Mitochondrial membrane potential Membrane permeability (Cell death ) RF ZnO mg L-1 (ppm) Relative fluorescence (RF) ZnO mg L-1 (ppm) Reactive oxygen species (ROS) production Dynamic Energy Budget (DEB) modeling of NEC NEC = 223 ± 56 ppb Expt data from Cole, Cherr et al., in prep ZnO mg L-1 (ppm)
BUT – it’s not always that simple (Exptsby L. Stevenson on silver ENMs and a freshwater alga) Size of AgNPs (nm) New culture One week old Two weeks old Per capita growth rate of algal cultures 5 mg/L citrate-coated AgNP Smaller particles more toxic than aggregates Particles aggregate in older batch cultures Hypothesis: algae excrete soluble organic compounds that interact with particles and dissolved metals ADDITIONAL FEEDBACK TERM(S) + NEW E-STATE INTERACTIONS New culture One week old Two weeks old
Effects of Cd-Se quantum dots on bacterial populations (Pseuomonasaerigunosa)
Contrasting QD toxicity with toxicity of dissolved Cd1-3 Strategy: Use DEB models to charcterizedifferences in bacterial growth response to Cd(II) and CdSe Quantum dot (QD) exposure 1. Data from J. Priester et al. Environmental Science and Technology 43:2589-2594 (2009). 2. T. Klanjscek, J. Priester, P.A. Holden and R.M. Nisbet, PlosONE, 7(2): e26955. doi:10.1371/journal.pone.0026955) 3. T. Klanjscek, J. Priester, P.A. Holden and R.M. Nisbet, Ecotoxicology, in review
Contrasting QD toxicity with toxicity of dissolved Cd1-3 Strategy: Use DEB models to charcterizedifferences in bacterial growth response to Cd(II) and CdSe Quantum dot (QD) exposure • New feedback to environment required to fit DEB model to control (zero Cd) curve 1. Data from J. Priester et al. Environmental Science and Technology 43:2589-2594 (2009). 2. T. Klanjscek, J. Priester, P.A. Holden and R.M. Nisbet, PlosONE, 7(2): e26955. doi:10.1371/journal.pone.0026955) 3. T. Klanjscek, J. Priester, P.A. Holden and R.M. Nisbet, Ecotoxicology, in review
Contrasting QD toxicity with toxicity of dissolved Cd1-3 Strategy: Use DEB models to charcterizedifferences in bacterial growth response to Cd(II) and CdSe Quantum dot (QD) exposure • New feedback to environment required to fit DEB model to control (zero Cd) curve • Model with toxic effect on resource assimilation and mortality best fits response to Cd (II) and to ROS data 1. Data from J. Priester et al. Environmental Science and Technology 43:2589-2594 (2009). 2. T. Klanjscek, J. Priester, P.A. Holden and R.M. Nisbet, PlosONE, 7(2): e26955. doi:10.1371/journal.pone.0026955) (2012) 3. T. Klanjscek, J. Priester, P.A. Holden and R.M. Nisbet, Ecotoxicology DOI 10.1007/s10646-012-1028-7 (2013)
Modeling the effect of QDsRule of the game: no change in Cd toxicity model Cd2+ interferes with assimilation and enters the cell → previous toxicity model QD dissolution introduces Cd2+ in environment CdSe CdSe CdSe QDs associate with the cell ROS produced inside the cell affect all cellular processes Associated QDs produce ROS affecting membrane processes
Toxicity mechanism for Quantum Dots • Model selection from fitting growth trajectories not possible • Measurements of Reactive Oxygen Species (ROS) allow model selection
Effects of metal oxide nanoparticles on populations of marine mussels (Mytilus spp.)
Effects of ZnO NPs on mussel physiology (Expts. By Shannon Hanna) • Adult marine mussels, Mytilusgalloprovincialis, were exposed to ZnO NPs for 12 weeks at concentrations up to 2 mg L-1. • Basic measurements on individuals(2 food levels) • 1) weights of shell, gonad, somatic tissue • Zn distribution within organism • 3) Tank clearance rates information on food consumed. • Iindividualclearance rates • Oxygen consumption rates. • Population level prediction • Aims to extract enough information to project effects on lifetime reproduction (previous experience in Muller, E.B. et al. Ecotoxicology 19: 38-47 (2010)) used to estimate parameters From DEB model
EC50 EXPECTED LIFE-TIME PRODUCTION OF REPRODUCTIVE MATTER • - EC50 for a given food level • MUCH SMALLER THAN • FOR INDIVIDUAL RATES • (e.g. 1.5 mg/l for feeding) • Consequence of ontogenic • asymmetry
Phytoplankton-zooplankton interactions DEB-IBM predicts effects of ontogeny asymmetry* * Unpublished work by Benjamin Martin
Take home messages Structured population models (or IBMs) can help relate sub-organismal information (cheap and fast) to population dynamics (slow, expensive and important) Abstract representation of individual organism (Kooijman’s DEB theory) has practical value Experiments are revealing new feedbacks involving metabolic products Ontogeny asymmetry impacts levels at which toxic effects impact populations