Spatial Metadata Extraction Algorithm: Efficient Geo-Polygon Creation for Airborne Data
10 likes | 121 Views
A detailed algorithm for creating Geo-Polygons from airborne data points to improve spatial metadata extraction efficiency for data collected during aircraft missions.

Spatial Metadata Extraction Algorithm: Efficient Geo-Polygon Creation for Airborne Data
E N D
Presentation Transcript
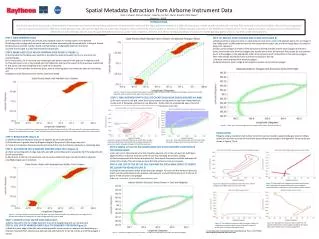
Mark J. Schwab1, Michael Stanley1, SiweiXu1, Jon Pals1, Mary J. Brodzik2, Cathy Fowler2 1Raytheon 2NSIDC STEP 1 GRID CONSTRUCTION a) Find Maximum and Minimum Latitude and Longitude values for all data points in the data file. b) Starting with a configurable minimum cell size calculate how many grid cells would exist in the grid. Double cell dimensions until the number of grid cells falls below a configurable maximum threshold. c) Create the final grid as a two dimensional list of grid cells. • STEP 10: REDUCE POINT COUNTS AND CLEAN UP (FIGURE 6) • a) Reduce points in exclusion zones. In each exclusion zone turn a series of 3 adjacent points into a triangle. If the middle point is sufficiently far from the line created by the other two, and the triangle does not contain a data point, remove it. • b) Clean up the polygon if needed. If the exclusion hull being checked and the outer polygon hull share a point, remove the point from the polygon and put the points from the exclusion hull, except for the common point, in the polygon in the appropriate order at the common point’s old position in the exterior polygon. Then remove that discrete exclusion hull from the exclusion hull list. • c) Remove collinear points from exterior polygon. • d) Repeat exclusion zone triangle point reduction process on the exterior polygon. STEP 2 MARK GRID CELLS WHICH CONTAIN DATA POINTS ( FIGURE 1) a) Starting with the first data point position in the data file, determine which cell it is in and mark it as containing data. b) For every point, if it is not in the last marked grid cell, hash to the cell in the grid that it might be inside. c) If the data point is not in the hashed cell, then follow the line from the center of the previously marked cell to that point, and move along that line to each cell in between. d) When a cell is found that contains the point, mark it as having data, and it takes the place of last marked cell. e) Repeat until all data points from the file have been tested. Spatial Metadata Extraction from Airborne Instrument Data Figure 3: Using the same data swath this shows the points chosen in Step 6 to use as vertices for the polygon, shown in blue, as the algorithm walks around the outer edge of the selected cells. • STEP 7: FIND INTERIOR EMPTY CELLS TO CREATE EXCLUSION ZONES (FIGURES 4A &4B) • a) For each column in the grid, move from top to bottom starting with the top most marked data cell. Create a list of following unmarked or non-data cells. If data cells are encountered again, the list of intermediate non-data cells are inserted into the set of exclusion zone cells. Figure 6: Close up of reduced polygon points. Compare with number of points in Figure 5. Figure 1: This shows a subset of the location information for data collection sites for the LVIS instrument. The instrument sweeps side to side as the airplane flies creating a “swath” of data. Every cell that contains data from the original grid created in step 1 gets marked. CONCLUSION Polygons using a relatively small number of vertices can be created to approximate geo-location of data collection sites from a variety of instrument types without any change to the algorithm. Some results are shown in Figures 7(a-d). • STEP 3: BRIDGE GAPS (Figure 2) • a) Check the distance between each pair of adjacent points in the data file. • b) If the distance is greater than the diagonal length of the grid cell, then a gap may exist. • c) Create a line between those two points and mark all the cells that the line intersects as containing data. INTRODUCTION Due to the volume of data points collected from instruments on airborne/aircraft data collection missions and the nature of the flight paths themselves it is difficult to produce reliable spatial metadata for the data files collected during these flights. We outline one approach that we found worked well for Operation IceBridgedata sets. We use the algorithm to create Geo-Polygons with a sufficiently small number of vertices for efficient spatial searching in the EOSDIS Core System (ECS). These spatial metadata will allow users to efficiently and effectively search IceBridgeaircraft data through ECHO/Reverb and any other tool created to interface with these metadata holdings, including the IceBridgedata portal which is currently under development. Figure 4B: Zoom of Exclusion zones. All of the cells inside the Exterior Polygon get marked and are shown in blue. Figure 4A: Sample of data path taken by an aircraft which includes enclosed loops that we want excluded from spatial metadata. The grey area is used in subsequent images for illustrative purposes. • STEP 8: BREAK UP LIST OF EXCLUSION ZONE CELLS INTO DISCRETE CONTIGUOUS EXCLUSION ZONES • a) For each cell in the exclusion zone list, check for adjacent cells in the exclusion list. Add those adjacent cells to a discrete exclusion zone cell sub-list, repeating the process, polling. • b) If more empty cells still exist on the master list, then repeat the process until the exclusion cell master list is empty. This will create as many discrete exclusion zones as necessary. • STEP 4: ADD BUFFER CELLS AROUND EXISTING DATA CELLS (Figure 2) • a) Check surrounding cells of edge data cells, and add surrounding cells to a separate list if the adjacent cells do not contain data. • b) Add this list to the list of marked data cells to create a buffer cell layer around the data to allow for simplified polygon point reduction. • STEP 9: USE LIST OF THE SET OF CELLS WITHIN THE EXCLUSION ZONES TO CREATE EXCLUSION POLYGONS (FIGURE 5) • a) Using the same process used to create the outer polygon. For each cell that borders a data cell, select a corner point based on the previous cell’s position, and add that corner point to the list of points in the exclusion zone polygon. • b) Repeat, if needed, for each discrete exclusion zone. Figure 7B: Data swath from sweeping laser measuring elevation with hundreds of thousands of data points can be spatially represented with a small fraction of the original number of points. Figure 7A: Data path from airborne radar instrument. Exterior polygon and multiple exclusion zones are shown. Figure 2: This figure shows the same subset of LVIS data. The green shows the buffer cells added to the outer edge of all of the data cells and the cells along the line used to bridge gaps (Step 3) in the data. • STEP 5: CREATE LIST OF OUTER EDGE DATA CELLS • a) Add a data cell to the list of edge data cells if any of its neighboring cells are not data cells. Figure 7D: Data path from airborne radar instrument. The algorithm follows the contours tightly and follows the spatial extent much better than a convex hull algorithm . • STEP 6: USE LIST OF MARKED DATA CELLS TO GENERATE POLYGON (Figure 3) • a) Walk the outer edge of the data cells selecting specific corner points on adjacent cells depending on direction traversed from the previous data cell and add that point to the list. Continue until the polygon is closed. Figure 7C: Data path from airborne radar instrument. Notice the single data point captured by itself and the small number of points used to represent the spatial extent. Corresponding author: Mark SchwabEmail: schwabm@nsidc.org Phone: +1.303.735.3061 AGU Fall Meeting IN51B-1586, 9 December 2011 Figure 5: Resultant Polygon and Exclusion zones. The exclusion zones have been made into distinct polygons.