
Optimizing Workflow Efficiency in Aseptic Compounding at Midland Regional Hospital Tullamore
This audit evaluates current practices in the aseptic compounding unit of Midland Regional Hospital Tullamore, aiming to enhance productivity through lean processing. By comparing outcomes before and after workflow changes, it has identified a significant reduction in time lost during the compounding process, decreasing from an average of 60 minutes to 40 minutes. The study emphasizes the importance of efficient practices for better patient outcomes and outlines potential savings through batching techniques. Findings serve as a blueprint for ongoing improvements in hospital pharmacy operations.

Optimizing Workflow Efficiency in Aseptic Compounding at Midland Regional Hospital Tullamore
E N D
Presentation Transcript
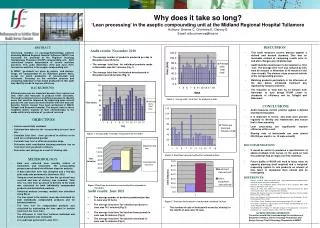
Why does it take so long?‘Lean processing’ in the aseptic compounding unit at the Midland Regional Hospital TullamoreAuthors: Greene C, Crimmins É, Garvey EEmail: eilis.crimmins@hse.ie  This audit measures current practice against a defined and desired standard. This was an invaluable method of comparing results prior to and after changes were implemented. Audit identifies weaknesses to be targeted i.e. time ‘lost’. The average time ‘lost’ was reduced by 33% from 60 minutes in November to 40 minutes in the June re-audit. The slowest steps occurred outside of the compounding process. Batching products particularly in the afternoon of the day before scheduled treatment day significantly reduces total time. The reduction in ‘total time’ by 12 minutes from November to June brings ROHP closer to standards of efficiency met by Tallaght and Beaumont. DISCUSSION Audit results: November 2010 • The average number of products produced per day in November was 25 items. • The average ‘total time’ for individual products made in November was 85.7 minutes (Fig. 1) • The average ‘total time’ for batched bevacizumab in November was 56 minutes (Fig. 2) ABSTRACT Increasing numbers of oncology/haematology patients attending Midland Regional Hospital Tullamore (MRHT) has increased the workload of the Regional Oncology Haematology Pharmacy (ROHP) compounding unit. Staff restrictions require optimisation of current workflow practices. This audit (November 2010 and June 2011) focused on workflow in the aseptic compounding unit. In MRHT, ‘go-aheads’ are given by nurses and doctors. Drugs are compounded on an individual patient basis, except for batch production of bevacizumab and cetuximab. Focusing on the workflow process and comparing individual versus batch production in this audit may identify trends to improve efficiency. BACKGROUND Efficient processes are important because they require less time, effort and resources to produce better outcomes.This audit examined current workflow processes to identify areas that could be improved. By improving upon current practice the aim was to be more efficient with time and cost benefits. Similar reviews have been performed at AMCH, Tallaght and Beaumont hospital. The aseptic units in those hospitals deliver majority of their chemotherapy to the wards within sixty minutes of ‘go-ahead’ received. Figure 3. Average daily ‘total time’ for products in June • Audit measures current practice against a defined and desired standard. • It is important to review and audit work practice regularly to identify any weaknesses and ensure that it flows smoothly. • Lean processing can significantly improve efficiency within a unit. • Sharing vials of bortezomibcan save almost €25,000 per month ( i.e. 18 vials a month) RECOMMENDATIONS • It would be useful to produces a questionnaire to obtain feedback from nurses on the ward on how this audit has had an impact on their workflow. • Future audits of ROHP will need to focus more on capacity planning (staff required) and a ‘weighted’ measuring system to rate products on amount of time taken to compound them should also be investigated. REFERENCES: • Hartree, N. 2010. Audit and Audit Cycle http://www.patient.co.uk/doctor/Audit-and-Audit-Cycle.htm (Accessed 18/08/11) • Benjamin A. The Competent Novice: Audit: how to do it in practice. BMJ. 2008 May 31; 336(7655): 1241–1245 • Deanna R. Willis, MD, MBA Fam Pract Manag. 2005 Apr;12(4):61-66. Make every minute count: tools to improve office efficiency. • Beaney AM. Quality Assurance of Aseptic Preparation Services 4th Ed. London Pharmaceutical Press 2006 • Rules and Guidance for Pharmaceutical Manufacturers and Distributors 7th Ed. Pharmaceutical Press 2007. • Cox, Phillips, Tighe. Capacity planning for chemotherapy. IPJ July 2007. • N O’ Boyle. Designing a capacity plan for the Aseptic Compounding Unit in St. James’ Hospital. IPJ July 2007. • Vandenbrouche V, Robays H. Economic impact of the preparation scenario for cytotoxic drugs: an observational study. EJHP, Vol 14 2008. CONCLUSIONS OBJECTIVES • Assess overall daily workload • Calculate time taken for the ‘compounding process’ each day • Calculate ‘total time’ - from ‘go-ahead’ to delivery to the ward for a compounded product • Calculate time ‘lost’ at different workflow steps • Determine what contribution batching products has on ‘total time’ from go-ahead to delivery • Determine cost savings asa result of sharing vials Figure 1. Average daily ‘total time’ for products in November Figure 4. Total time taken for batched bevacizumab in June METHODOLOGY • Data was collected from monthly folders of worksheets and timesheets. The compounding process was divided into different steps for analysis. • A data collection form was designed and a two-day pilot study was performed in November 2010. • Using an excel worksheet, the time the ‘go-ahead’ was received and time of delivery was recorded. ‘Total time’ (i.e. time from ‘go ahead’ to delivery to the ward) was calculated for both individually compounded products and for batched products. • Statistical analysis (average, median) was calculated using Excel. • The time spent in the isolator room was calculated for both individually compounded products and for batched products. • The‘time lost’ for compounded products was calculated by subtracting the time spent in isolator room from the ‘total time’. • The difference in ‘total time’ between individual and batch production was compared. • A re-audit was performed in June 2011 Figure 2.Total time for batched vs non-batched bevacizumab in November Audit results: June 2011 • The average number of products produced per day in June was 20 items. • The average ‘total time’ for individual products in June was 74.1 minutes (Fig.3) • The average ‘total time’ for batched bevacizumab in June was 49 minutes (Fig.4). • The average ‘total time’ for batched cetuximab in June was 16 minutes (Fig.5) Figure 5. Total time for batched vs non-batched cetuximab in June • The number of vials of bortezomib saved by ‘sharing’ in the month of June was 18 vials. ACKNOWLEDGEMENTS The author would like to acknowledge the assistance of Elizabeth Crimmins, Senior Oncology Pharmacist and Evelyn Garvey Chief II Oncology Pharmacist in MRHT.


