Hospital Discharges by Service: 2010 vs 2009 Analysis and MLOS Trends
10 likes | 118 Views
This report presents a comprehensive analysis of hospital discharges by medical service for the years 2010 and 2009. It captures essential metrics including the percentage change in discharges and the mean length of stay (MLOS) for various specialties such as Oncology, Pain Management, and Urology. The data highlights trends and shifts in service utilization, providing insights into areas that experienced growth or decline. Understanding these dynamics is crucial for healthcare providers and policymakers aiming to improve service delivery and patient outcomes.

Hospital Discharges by Service: 2010 vs 2009 Analysis and MLOS Trends
E N D
Presentation Transcript
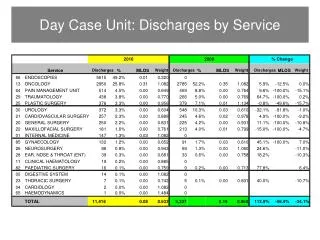
Service Discharges % MLOS Weight Discharges % MLOS Weight Discharges MLOS Weight 66 ENDOSCOPIES 5615 49.2% 0.01 0.320 0 13 ONCOLOGY 2950 25.8% 0.31 1.082 2785 52.2% 0.35 1.082 5.9% -12.5% 0.0% 64 PAIN MANAGEMENT UNIT 514 4.5% 0.00 0.649 469 8.8% 0.00 0.764 9.6% -100.0% -15.1% 29 TRAUMATOLOGY 438 3.8% 0.00 0.770 266 5.0% 0.00 0.769 64.7% -100.0% 0.2% 25 PLASTIC SURGERY 376 3.3% 0.00 0.956 379 7.1% 0.01 1.134 -0.8% -49.6% -15.7% 30 UROLOGY 372 3.3% 0.00 0.604 548 10.3% 0.03 0.610 -32.1% -91.8% -1.0% 21 CARDIOVASCULAR SURGERY 257 2.3% 0.00 0.888 245 4.6% 0.02 0.978 4.9% -100.0% -9.2% 20 GENERAL SURGERY 250 2.2% 0.00 0.831 225 4.2% 0.00 0.931 11.1% -100.0% -10.8% 22 MAXILLOFACIAL SURGERY 181 1.6% 0.00 0.761 213 4.0% 0.01 0.799 -15.0% -100.0% -4.7% 01 INTERNAL MEDICINE 147 1.3% 0.03 1.082 0 85 GYNAECOLOGY 132 1.2% 0.00 0.652 91 1.7% 0.03 0.610 45.1% -100.0% 7.0% 26 NEUROSURGERY 86 0.8% 0.00 0.943 69 1.3% 0.00 1.060 24.6% -11.0% 28 EAR, NOSE & THROAT (ENT) 39 0.3% 0.00 0.681 33 0.6% 0.00 0.758 18.2% -10.3% 11 CLINICAL HAEMATOLOGY 19 0.2% 0.00 0.885 0 82 PAEDIATRIC SURGERY 16 0.1% 0.00 0.759 9 0.2% 0.00 0.713 77.8% 6.4% 05 DIGESTIVE SYSTEM Day Case Unit: Discharges by Service 2010 2009 % Change 14 0.1% 0.00 1.082 0 23 THORACIC SURGERY 7 0.1% 0.00 0.742 5 0.1% 0.00 0.831 40.0% -10.7% 04 CARDIOLOGY 2 0.0% 0.00 1.082 0 65 HAEMODYNAMICS 1 0.0% 0.00 1.484 0 TOTAL 11,416 0.08 0.633 5,337 0.19 0.960 113.9% -56.4% -34.1%