Download

1 / 30
300 likes | 390 Views
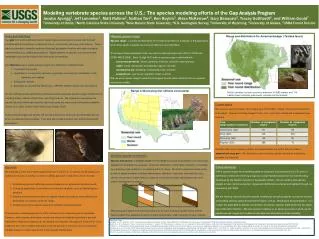
Explore the challenges in species occupancy modeling using a toy example with added covariates. Learn about assumptions, covariate details, and typical usage for fitting models. Discover the Cornell Lab of Ornithology's mission and the Birds in Forested Landscapes project. Gain insights into data collection methods, visit protocols, and habitat characteristics recorded in the project.

E N D
Machine Learning Problems in Species Occupancy Modeling Rebecca Hutchinson March 25, 2010
Multiple Visits • Visit each site more than once, recording detection histories Yit • E.g. • Population closure assumption: the species occupancy status does not change over the course of the visits to a site.
Assumptions • Species is never misidentified. • Occupancy status is constant across visits. • Visits are separated enough to be conditionally independent, given the occupancy status. • Sites are independent.
Xi Wit oi Zi Yit dit t=1,…,T i=1,…,M a b Key: square=discrete circle=continuous unshaded=latent grey=observed pink=parameter blue=deterministic function of inputs dashed=repeated section Xi = occupancy covariates at site i oi = probability of occupancy at site i Zi = true, unobserved occupancy status of site i a = parameters of occupancy model Wit = detection covariates at site i, visit t dit = probability of detection at site i, visit t Yit = observed presence/absence at site i, visit t b = parameters of detection model
Some details • Conditional distributions: • Conditional log-likelihood • Expected joint log-likelihood
Typical Usage • Fit a small number of models with differing (small) sets of covariates, using the conditional log-likelihood objective • E.g. model 1 vs. model 2 where • o1 ~ rainfall + elevation, d1 ~ weather + time-of-day • o2 ~ rainfall + temperature, d2 ~ underbrush-density • Evaluate models with AIC • Books on this approach: Mackenzie et al 2006, Royle et al 2007.
Outline • Citizen Science: 2 motivating datasets • Problem 1: Integrating more flexible models for occupancy and detection • Regularization • Boosted regression trees • (Joint work with Tom Dietterich) • Problem 2: Alternative detection models • Experts vs. novices • Relaxing assumptions • (Joint work with Weng-Keen Wong and Jun Yu)
Cornell Lab of Ornithology Mission: To interpret and conserve the earth’s biological diversity through research, education, and citizen science focused on birds.
Birds in Forested Landscapes (BFL) • Goals: • Determine habitat/landscape requirements of forest-dwelling birds (especially thrushes) • Translate results into management recommendations for conservation • Develop a network of experienced citizen scientists • BFL is a continent-wide project that has engaged over 1,000 volunteers who surveyed over 3,000 study sites. • Have data from 1997-2006 • Participants follow a rigorously tested protocol that includes: • selecting suitable study sites • visiting these sites at least twice during the breeding season and • measuring a variety of habitat variables. • http://www.birds.cornell.edu/bfl/
BFL data • Select forest patches, then survey points, and one or more species of interest. • Visit 1: earliest date when all your study species have arrived • Want beginning of breeding period, but no birds still migrating. • Visit 2: 2-4 weeks later • Breeding should be underway, different evidence available. • Record presence/absence of 22 possible breeding behaviors observed in each period on each visit. • Record presence/absence of competitors/predators on each visit. • Record environmental variables at large, medium, and small scales. • Observers work in teams of 1-4 people.
BFL data: visit protocol example • Observation Period (mandatory 10 minutes) Look and listen for predators, cowbirds, and study species • Playback Period (mandatory 5 minutes per species) Species 1: play songs, calls, or drums for 1 minuteSpecies 1: watch/listen for 1 minuteSpecies 1: repeat songs, calls, or drums for 1 minuteSpecies 1: watch/listen for 2 minutesSpecies 2: play songs, calls, or drums for 1 minuteSpecies 2: watch/listen for 1 minuteSpecies 2: repeat songs, calls, or drums for 1 minuteSpecies 2: watch/listen for 2 minutes • Behavior Watch Period (mandatory 10 minutes)Play eastern or western mobbing calls for 5 minutes while looking and listening for study speciesWatch/listen for 5 minutes
BFL data: habitat characteristics • Survey point (where observer stands) • Latitude/longitude • Elevation • Distance to nearest edge, road, water, occupied building • Study site (radius=150m) • Hydrology during breeding season • Forest cover type • Slope • Land use • Land ownership • Canopy characteristics • Low vegetation characteristics • Landscape level (2500 acres) • Patch edge (what habitats are adjacent) • Forest patch size • Percentage of forest • Linear distance of edge • Distance to nearest 100 & 500 acre patches (if patch is less than 1000 acres)
Increasing model flexibility • Why? • Many possible habitat variables • interactions? • Exploratory modeling with many covariates rather than hypothesis testing with few • 2 ideas: • Regularization • Boosted regression trees
How to regularize these models? • One possible penalty: • How should the two components be weighted? • tug-of-war between occupancy and detection to explain the all-zero detection histories
Preliminary synthetic data results • 8 covariates for each model, half of which truly had non-zero coefficients • Choice of objective function seems more important than regularization parameters
Posterior Regularization • [Ganchev, Gillenwater, Graca, and Taskar, 2009] • Regularization constraints on posterior expectations instead of parameters, for example: • Expected occupancy is less than 60% • Of the all-zero detection histories, only half can be ‘explained away’ by the detection model
Boosted Regression Trees • Popular in species distribution modeling • [Elith et al 2006] • Functional gradient ascent [Friedman 2001] • regression trees predict F(X) and G(W) • F and G are fed through logistic() to get o and d • Current challenge: tuning • learning rate (shrinkage) • number of trees to grow at each stage • depth of trees • number of stages
eBird—Current Stats (2009) • ~70,000 users • ~540,000 site visitors • 173 countries/territories • >1,500,000 checklists submitted • 2,945 species reported • 21 million observations reported
Northern Cardinal Distribution (Frequency of Detection) • Gray – not reported • Tan – insufficient data • White – not covered
Extensions needed for eBird? • Alternative detection model • add a node for expertise of observer • Relax the assumption of no-misidentifications • Y|Z=1 ~ Bernoulli(d) • Y|Z=0 ~ Bernoulli(h) • (instead of 0)
Model with expertise node Bic Zis Yics Ej Uj Xi s j Wics c i
Preliminary results: Synthetic data Synthetic data generated from EOM with different levels of false positives Area under ROC curve Slide courtesy of Jun Yu
Preliminary results: eBird data • data from New York from May and June in year 2006, 2007 and 2008. • 27 by 64 Checkerboarding [New York State: Width-285 miles (455 km) and Length-330 miles (530 km): • Each Cell is roughly 16.8 km by 8.3 km. • There are roughly 200 sites generated during training. Slide courtesy of Jun Yu
More challenges • Sampling bias • Spatial autocorrelation • For BFL, modeling multiple occupancy states • For eBird, modeling abundance • Multi-species approaches • Dynamic models • migration • range shift