Download
1 / 9
90 likes | 261 Views
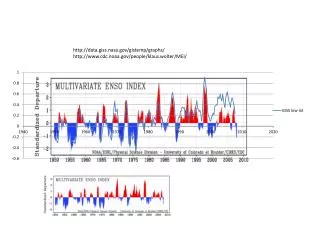
http://data.giss.nasa.gov/gistemp/graphs/ http://www.cdc.noaa.gov/people/klaus.wolter/MEI/. The difference between low lat temp and ENSO index Temp explodes mid 60s, 80s and 90s. What else in the climate system exploded early in those decades? Volcanoes

E N D
http://data.giss.nasa.gov/gistemp/graphs/ http://www.cdc.noaa.gov/people/klaus.wolter/MEI/
The difference between low lat temp and ENSO index Temp explodes mid 60s, 80s and 90s. What else in the climate system exploded early in those decades? Volcanoes Contrary to the model results lower stratosphere temp increases after the initial drop, next page. Indicates that the cause of the drops is the large volcanic eruptions. Perhaps by ozone depletion.
Data taken from AR4WG1 Tech. Summary fig. TS.7 and http://www.sciencemag.org/ feature/data/1046907s1_large.jpeg Stable low or decreasing temp lead to increased heat content Stable high give unchanged heat content
Curves taken from http://isccp.giss.nasa.gov/projects/browse_fc.html Willis calc Temp drops in the stratosphere so both upwelling and downwelling LW is reduced , only a minor net change (slide 8) Observation Quite stable, seems to follow the ENSO variation and volcano impact. Volcano and El Nino? Willis calc -2,8 W/m2 (+2,8 downwelling) Observation -2,5 W/m2 La Nina
Willis calc 1,8 W/m2 Observation 1,6 W/m2 The large drop from the end of 2001 is according to ISCCP not real, an artifact in the dataset Same for the LW up, slide 5. Willis calc 1,5 W/m2 Observation 1,3 W/m2
In addition: Stratospheric temp decrease match observed, see slide 3. Tropospheric temp increases less than surface temp, match MSU measurements showing only a minor temp increase in high troposphere. There’s a net loss of energy to the stratosphere and a net gain from the surface. Albedo apparently does not match, but since clouds are a major factor it is hard to compare. LW fluxes between surface and troposphere is driven by the weather which is chaotic and show hugh fluctuations, so it makes no sense comparing in this context.
http://homepage.mac.com/williseschenbach/.Public/global_energy_budget.xlshttp://homepage.mac.com/williseschenbach/.Public/global_energy_budget.xls More on CA: http://www.climateaudit.org/?p=2581 Stratospheric SW absorption reduced from 2,82% to 2,0% for simulating the change from 80s to 90s
Tropospheric LW absorption increased from 90% to 90,5% The only match with observations is increased surface temp