Download
1 / 10
100 likes | 207 Views
Minimizing Speaker System variations using FINELab™ QC Intelligent Limits in QC SPL limits + sensitivity can be set from the actual pre-production data How to find the “Golden Average” Driver

E N D
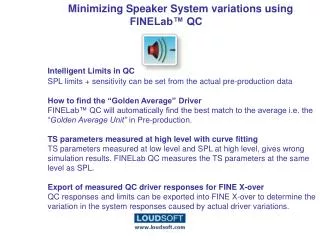
Minimizing Speaker System variations using FINELab™ QC Intelligent Limits in QC SPL limits + sensitivity can be set from the actual pre-production data How to find the “Golden Average” Driver FINELab™ QC will automatically find the best match to the average i.e. the “Golden Average Unit” in Pre-production. TS parameters measured at high level with curve fitting TS parameters measured at low level and SPL at high level, gives wrong simulation results. FINELab QC measures the TS parameters at the same level as SPL. Export of measured QC driver responses for FINE X-over QC responses and limits can be exported into FINE X-over to determine the variation in the system responses caused by actual driver variations.
Intelligent Limits in QCThe tolerance limits are allowed to move up and down with the sensitivity tolerance. This is the most realistic way to test the frequency response limits
Intelligent Limits in QC • The limits are broken up in ranges separated by white square points. These can be selected and changed individually by clicking with the mouse or by using the up/down arrows for the points. I have selected point #10 (shown in magenta when selected) and I can either just drag and move the point, or use the upper and lower fields (Red) to change the frequency and dB deviation from the reference. • I have specified the sensitivity range from 700-1200 Hz (Blue fields), where the sensitivity is calculated as the average with a +/- 1.5dB tolerance as specified in the two lower fields (Blue). The radio button “Compensate” is also activated, meaning that the tolerance limits are allowed to move up and down with the same tolerance. This is the most realistic way to test the frequency response limits; for example a driver with +1dB sensitivity should be tested with the limits offset by +1dB.
How to find the “Golden Average” DriverFINELab™ QC will automatically find the best match to the average i.e. the “Golden Average Unit” in Pre-production.
TS parameters measured at high level with curve fittingTS parameters measured at low level and SPL at high level, gives wrong simulation results. FINELab QC measures the TS parameters at the same level as SPL.
Export of measured driver responses to FINE X-overQC responses and limits can be exported into FINE X-over to determine the variation in the system responses caused by actual driver variations.
Export of measured QC responses in Excel CSV formatQC responses and limits can be exported to Excel for further statistical calculations
FINEBuzz is the new Rub & Buzz MethodThis new method is based on Danish research on hearing mechanisms with a completely new algorithm
FINEBuzz showing 1 sugar crystalThis new method is very sensitive and can detect even a small piece of sugar