Download
1 / 16
160 likes | 247 Views
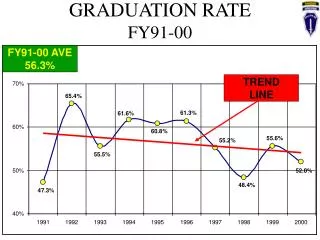
Practical Strategies and Tools to Increase the Graduation Rate. INCREASING GRADUATION RATE. Alabama Graduation Tracking system. INCREASING GRADUATION RATE. Pyramid of Intervention The Social and Behavioral Components.

E N D
Practical Strategies and Toolsto Increase theGraduation Rate INCREASING GRADUATION RATE
Alabama Graduation Tracking system INCREASING GRADUATION RATE
Pyramid of InterventionThe Social and Behavioral Components How great of an impact do social and behavioral factors have on student success? How do these factors contribute to students “getting off track” and eventually dropping out of school? How do we respond and intervene?
Why do students fail? • Attendance is 8 times more predictive of failure than prior test scores. Demographic & economic background characteristics explain 7% of course failures Eighth-grade test scores explain an additional 5% (12%total) Student behaviors-absences and effort - explain an additional 61% (73% total) • Failures are much more strongly related to course absence than to incoming achievement.
Each day of absence in ninth grade is associated with a dramatically reduced likelihood of graduating • 0-4 – 87% • 5-9 – 63% • 10-14 – 41% • 15-19 - 21% • 20-24 – 9% • 25-29 – 5% • 30-34 – 2% • 35-40 – 1%
When do students get off track? • Attendance is often a key barometer of a student’s connection with schooling. The majority ofstudents who drop out first stop attending school on a regular basis. In many cases their attendance decreases over several years. In the year before dropping out, it is common for students to attend school less than 70% of the time. Many times chronic attendance problems START in elementary school and a pattern of non-compliant behavior begins. However, attendance is not the only indicator.
Early Warning Systems It is now possible to identify who among elementary, middle, and high school students will likely drop out of high school unless on-going interventions occur. ABC’s of Dropout Prevention • Attendance Behavior Course Failure
Why are students dropping out? • Life Events: pregnancy, incarceration, health, needing to work. • Fade Outs: Students don’t see the point of staying in school. Often they have decent grades and attendance. They become disillusioned with school and believe they can make in life without a diploma. • Push Outs: Some students believe they are viewed as behavioral problems or low achievers and seldom attend school. Feeling that they are not capable of succeeding. They see administrative rules such as attendance policies as a mechanism to push them out. • Failure to Succeed at Transition Points: 3-4, 5-6, 8-9, 9-10
How do we respond? • Identification of students at risk • Alignment of resources • On-going development of school and wraparound supports
Pyramid of InterventionTerms • Intervention (I) • Remediation • Systematic Response (SR) • Timely (T) • Directive (D) • Universal Preventive (UP) 85% • Targeted Support (TS) 15% • Individualized Support (IS) 5%
Universal PreventionBehavior/Social • Analyzing School Wide/Classroom Data - Attendance - Disciplinary Referrals - Transition Data
Targeted Supports • “Off-Track” Indicators • Intervention - Systematic Response (SR) - Timely - Directive
Individualized Supports • Intervention • Systematic Response • Timely • Directive
Building a Pyramid of Intervention • With your school representatives list all the behavioral/social supports you currently have in place at your school. • Determine if they are I,SR,T,D. • Place them on your POI chart under Universal Preventive, Targeted Support, Individualized Support. • Share your completed chart with the group.
INCREASING GRADUATION RATE Conclusion