Download
1 / 11
110 likes | 201 Views
This paper explores the stochastic fluctuations of synaptic activity, focusing on neurotransmitter release variability and receptor binding dynamics. The modeling considers parameters such as glutamate concentration, vesicle position, and receptor distribution to understand neural coding better. The results shed light on the importance of variability in synaptic function and its impact on neural processes.

E N D
Stochastic Fluctuations of the Synaptic Function Francesco Ventriglia, Vito Di Maio BioSystems, vol. 67, pp.287-294, 2002 Chung, Ho-JinMar. 5, 2003
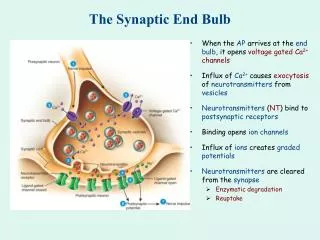
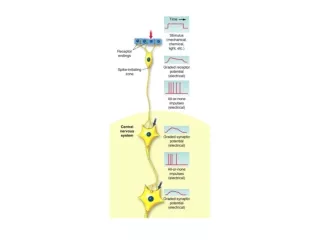
Introduction • The communication between neurons occurs at specialized junction called synapses. • Synaptic activity is necessary for computation of neural brain structures or neural coding. • The quantal Excitatory Postsynaptic Currents (EPSCs) produced by stimuli arriving to a single synapse had peak amplitudes in experimental procedure. • Stochastic variability of the synaptic response to quantal release of neurotransmitters is due to three factors. (C) 2003, SNU BioIntelligence Lab
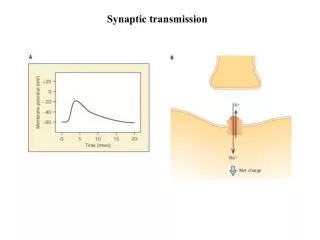
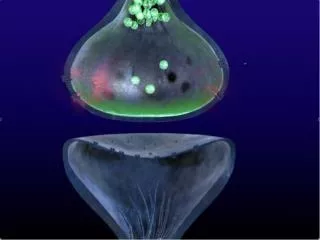
Synaptic transmission http://www.sumanasinc.com/webcontent/anisamples/neurobiology/synaptictransmission.html (C) 2003, SNU Biointelligence Lab
Model (1/4) • Modeling synaptic fluctuations considering three factors; the concentration value of Glutamate within a vesicle, the volume and the position of the vesicle in presynapse. • Assumed that • Each vesicle is filled with a predetermined number of neurotransmitters distributed uniformly. • A presynaptic spike arrives at a time t=o, starting the activation of a fusion pore. • AMPA receptors and NMDA receptors are randomly disposed on the Post Synaptic Density (PSD). • Tiles encompassed by the PSD perimeter contained receptors (one receptor per tile). (C) 2003, SNU Biointelligence Lab
Tile presynapse postsynapse (C) 2003, SNU Biointelligence Lab
Model (2/4) • Brownian motion of glutamate: Langevin equation ri: position of glutamate vi: velocity of glutamate m: mass i: ith of the Nm molecules contained in a vesicle : friction parameter white Gaussian noise • Time discretized Langevin equation: i: random vector with three components, each following N~(0, 1) (C) 2003, SNU Biointelligence Lab
Model (3/4) • Assumed that • Only AMPA receptors could contribute to the EPSC formation. • Each receptor had two binding sites for glutamate. • Four channel states: Basal (B)-closed, Active (A)-open, Inactivable (I)-closed, Desensitized (D)-closed • B0 B1 B2 A2 I2 D2 (0: unbound, 1: single-bound, 2: double-bound) (C) 2003, SNU Biointelligence Lab
Model (4/4) • Transition states B2 A2 • Opening time o and closing time c • Changes induced on the postsynaptic response: quantal EPSC Ir(t): incremental contribution to the postsynaptic current produced by the channels in the active open state Id(t): decremental contribution to the postsynaptic current of the channels in inactivated states ti: opening time of the ith channel tj: closing time of the jth channel IM: peak current conveyed by a single opened AMPA channel I: rise constant j: decay constant (·): step function ((x)=0 for x<0, (x)=1 for x0) (C) 2003, SNU Biointelligence Lab
Simulations & Results Fig.1 Concentration time course of glutamate in the synaptic cleft. A: effect of a vesicle centered on the Active Zone (AZ), releasing 1246 glutamate B: effect of a vesicle positioned at a distance of 90nm from the center of AZ, releasing 147 glutamate (C) 2003, SNU Biointelligence Lab
Simulations & Results Fig. 2. Number of glutamate hits for each tile of the PSD grid during a complete vesicle release. A: 1246, B: 147 molecules Fig. 3. EPSC ranges Upper: 147 molecules in a vesicle positioned at 90nm from the center of AZ Lower: 1246 molecules Superior: tile side of 14nm Inferior: tile side of 12nm (C) 2003, SNU Biointelligence Lab
Conclusion • The important presynaptic sources of variability such as the stochastic variation of glutamate concentration, volume and position of vesicles were considered in this paper. • The parameters used in simulation were based on empirically-derived data from literature. • The variability has importance in the understanding of neural coding. (C) 2003, SNU Biointelligence Lab