Interpreting Cladograms Notes
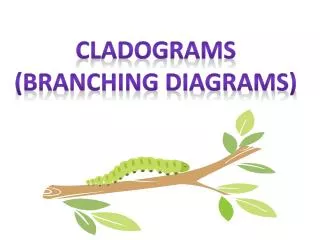
Interpreting Cladograms Notes. Interpreting Cladograms Big Idea: Phylogenies Depict ancestor and descendent relationships among organisms based on homology These evolutionary relationships are represented by Diagrams called cladograms (branching diagrams that organize relationships) .

Interpreting Cladograms Notes
E N D
Presentation Transcript
Interpreting CladogramsNotes Interpreting Cladograms Big Idea: Phylogenies Depict ancestor and descendent relationships among organisms based on homology These evolutionary relationships are represented by Diagrams called cladograms(branching diagrams that organize relationships)
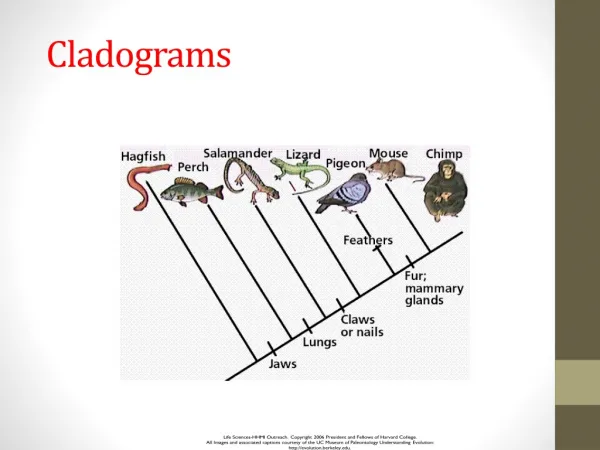
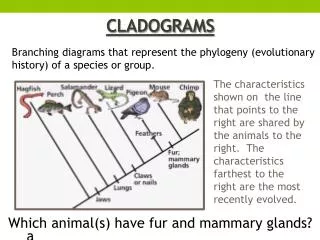
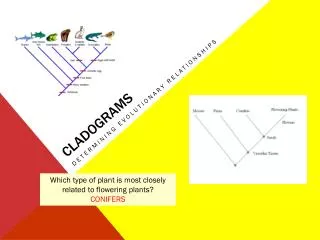
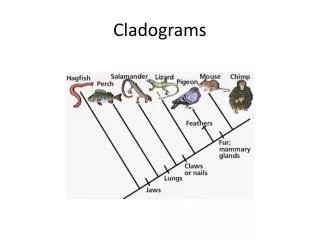
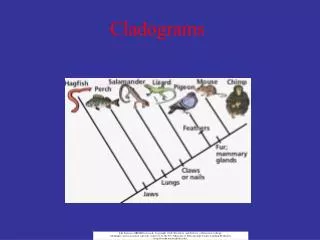
Reading Cladograms Read like a family tree: show patterns of shared ancestry between lineages. • When an ancestral lineage splits: speciation is indicated due to the “arrival” of some new trait. • Each lineage has unique traits to itself alone and traits that are shared with other lineages. each lineage has ancestors that are unique to that lineage and ancestors that are shared with other lineages — common ancestors.
Quick Question #1 What is our definition of a clade? (look back to zoology notes #1 if you cannot remember) • A group that includes a common ancestor and all the descendants (living and extinct) of that ancestor.
Reading Cladogram: Identifying Clades Using a cladogram, it is easy to tell if a group of lineages forms a clade. • Imagine clipping a single branch off the phylogeny • all of the organisms on that pruned branch make up a clade • So everything in the pink circle is a clade (common ancestor and all descendants)
Quick Question #2 • Looking at the image to the right: • Is the green box a clade? • The blue? • The pink? • The orange?
Reading Cladograms: Clades • Clades are nested within one another • they form a nested hierarchy. • A clade may include many thousands of species or just a few.
Interpreting Cladograms it's easy to misinterpret cladograms as implying that some organisms are more "advanced" than others however, cladograms don't imply this at all. when reading a cladogram, it is important to keep three things in mind
(mis)Interpreting Cladograms: One Evolution produces a pattern of relationships among lineages that is tree-like, not ladder-like.
(mis)Interpreting Cladograms: Two Just because we tend to read phylogenies from left to right, there is no correlation with level of "advancement."
(mis)Interpreting Cladograms: Three For any speciation event on a phylogeny, the choice of which lineage goes to the right and which goes to the left is arbitrary. The following phylogenies are equivalent:
Interpreting Phylogenies: Human Example • The points described above cause the most problems when it comes to human evolution. • It is important to remember that: • Humans did not evolve from chimpanzees. Humans and chimpanzees are evolutionary cousins and share a recent common ancestor that was neither chimpanzee nor human. • Humans are not "higher" or "more evolved" than other living lineages. Since our lineages split, humans and chimpanzees have each evolved traits unique to their own lineages.
Quick Question #3 What is this called? What do you think the red lines represent?
Creation of Cladograms Given a set of observations, phylogenetic analysis seeks to find the simplest branching relationships between organisms to depict their evolution. Heritable traits possessed by organisms, characters, are used to compare the organisms being studied. • Characters can be compared across organisms • physical traits • genetic sequences • behavioral traits.
3 Alternative, mutually exclusive Cladograms How Do We Choose Between Them?
INGROUP ORGANISMS PP RD PC Characters Fur/Mane No Yes Yes Yes Toes/Foot Many Toes One Hoof One Hoof One Hoof Wings No No Yes Yes Horn No No No Yes (Not an Ancestor, but a Stand-in to represent the Ancestral Condition) Eyes Yes Yes Yes Yes Tail Yes Yes Yes Yes Mouth Yes Yes Yes Yes Outgroup Derived States Primitive (ancestral) State
INGROUP ORGANISMS Outgroup PP RD PC Characters Fur/Mane No Yes Yes Yes Toes/Foot Many Toes One Hoof One Hoof One Hoof Wings No No Yes Yes Horn No No No Yes Eyes Yes Yes Yes Yes Tail Yes Yes Yes Yes Mouth Yes Yes Yes Yes Derived character states found in only one organism separate them from other organisms Horn 3 Steps (evolutionary transitions from ancestral derived) to explain this tree Wings Fur/Mane One Hoof Ancestral characters shared by all taxa link organisms together Eyes Tail Mouth
Taxa Outgroup RD PP PC Characters Fur/Mane No Yes Yes Yes Toes/Foot Many Toes One Hoof One Hoof One Hoof Wings No No Yes Yes Wings Loss of Wings 4 Steps (with wings developing convergently) Wings Fur/Mane One Hoof OR Wings 4 Steps (with wings developing in ancestral pony, and lost in PP)
Taxa Outgroup PC PP RD Characters Fur/Mane No Yes Yes Yes Toes/Foot Many Toes One Hoof One Hoof One Hoof Wings No No Yes Yes Wings Loss of Wings 4 Steps (with wings developing convergently) Wings Fur/Mane One Hoof OR Wings 4 Steps (with wings developing in ancestral pony, and lost in PP)
3 Steps The preferred cladogram is the simplest! (Least number of assumptions) So, which cladogram is the best description of the evolution of these little ponies? 4 Steps 4 Steps