Download
1 / 8
80 likes | 181 Views
Discover the impact of greenhouse gas emissions on developing countries, with a focus on Australia's emission reduction commitments and coal industry support. Learn about glacier retreat and the implications for water resources in China, India, and other countries. Explore emission reduction targets for developed nations and China's energy initiatives. Gain insights into the challenges and opportunities in combating climate change.

E N D
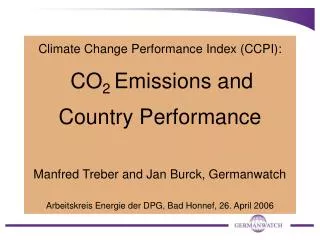
Per capita Greenhouse Pollution CO2e GDP PPP$ Australia USA Canada Russia EU (25) Japan Mexico Brazil China Indonesia India Developed Developing World Average Who’s Responsible?
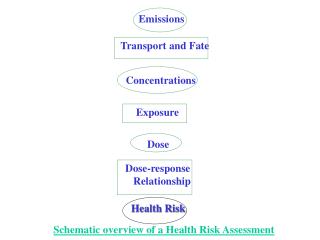
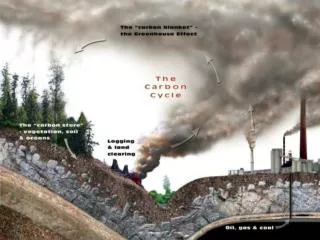
Climate Change Impacts Globally • 75% of the world's fresh water is stored in glaciers • 85% of the world's glaciers are in retreat • Qori Kalis glacier in Peru is shrinking at a rate of 200m pa – 40 times as fast as in 1978 • Hundreds of millions in China, India, Pakistan, Nepal, Peru, Ecuador, Bolivia and USA rely on glacier and snow melt for water
Impact on developing countries • 65 developing countries (½ the developing world's population) risk losing 280 million tonnes of cereal production as a result of climate change. $56 billion, 16% of agricultural GDP of these countries.1 1 UN Food and Agriculture Organisation, June 05
Australia’s Emission Reduction • On 15 December 2008 the Prime Minister agreed to reduce emission by 5% by 2020 based on 2000 levels • This increases to 15% if there is a global agreement • IPCC says developed countries should reduce emissions by 25 – 40% by 2020 based on 1990 levels • By 2020 the UK reduce emissions by 26% - 32%, Germany by 40% and Sweden by 25% • EU 20% by 2020, going to 30% with a comprehensive international agreement
China • Not historically responsible • Reduce energy intensity by 20% below 2005 by 2010, reducing projected emissions by 1.5 billion tonnes • China committed to retiring 50GW of inefficient coal and oil fired power plants by 2010 (Australia’s total capacity is 40 GW) • China has higher fuel efficiency standards for vehicles than Australia, Canada and the US.
Coal Industry Success • Under the CPRS the coal-fired power stations get $3.9 billion over five years • Australia’s emissions intensity of its electricity supply is the highest of any OECD country • It is 98% higher than the OECD average and 74% higher than the world average