Download
1 / 69
690 likes | 832 Views
AeroCom Emissions. autumn 2005. aerosol emission datasets. Contributors: Frank Dentener, Julian Wilson, Luisa Marelli, Jean Putaud (IES, JRC, Italy) Tami Bond (University of Illinois-Champagne, USA) Judith Hoelzemann, Stefan Kinne (MPI Hamburg, Germany)

E N D
AeroCom Emissions autumn 2005
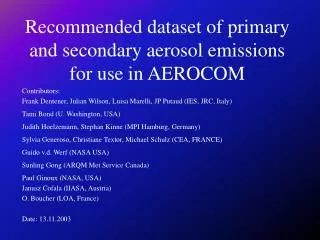
aerosol emission datasets Contributors: Frank Dentener, Julian Wilson, Luisa Marelli, Jean Putaud (IES, JRC, Italy) Tami Bond (University of Illinois-Champagne, USA) Judith Hoelzemann, Stefan Kinne (MPI Hamburg, Germany) Sylvia Generoso (EPFL-ENAC, Lusanne, Switzerland) Christiane Textor, Michael Schulz (LSCE Saclay, France) Guido v.d. Werf (Univ. of Amsterdam, Netherlands) Sunling Gong (ARQM Met Service Toronto, Canada) Paul Ginoux (NOAA-GFDL Princeton, USA) Janusz Cofala (IIASA Laxamburg, Austria) Olivier Boucher (Met Office Exeter, Great Britain) Akinori Ito, Joyce Penner (Univ. of Michigan, Ann Arbor, USA) recommendations for the year 2000 recommendations for the year 1750
Goal • to provide recommended data-sets for anthropogenic aerosol and precursor gases for year 2000 simulations and pre-industrial (year 1750) simulations • including recommendations for size-distribution of primary emissions • including recommendations for emission altitude
Emission data-sets • large scale biomass burning POM / BC / SO2 emissions (altitude resolved) • fossil fuel / biofuel related POM / BC emissions • SO2, including (altitude res.) volcanic emissions • SEA-SALT emissions (size resolved) • DUST emissions (size resolved) • DMS(sulfur) emissions • SOA ‘effective’ emissions POM Particulate Organic Carbon (1.4 OC [Org.Carbon] = 1POM) BC Black Carbon(or EC Elementary Carbon ) DMS DiMethyl Sulfide SOA Secondary Organic Carbon
Spatial Resolution • 1 degree latitude * 1 degree longitude • averages are given for each grid-box Units • kg /(time-period*) /(1x1 gridbox) * yearly, monthly or daily • for daily sea-salt and dust data log-normal distribution parameters are provided from which the emission flux can be calculated
Temporal resolution • Daily emissions • DUST • SEASALT • DMS • Monthly emission • Biomass Burning • SOA • Yearly emissions • All other data-sets higher temporal resolution data will be adopted only in sensitivity experiments
Emission Heights • all emissions < 100m(in lowest modeling layer) except • biomass burning (POM / BC / SO2) ECO-system dependent – six altitude regimes: • 0-.1km /.1-.5km /.5-1km /1-2km / 2-3km /3-6km • SO2 industry 100 - 300m • SO2 power-plants 100 - 300m • SO2 volcanic ( * location and altitude are provided) • Continuous:2/3 to 1/1 of volcano top* • Explosive:.5 to 1.5 km above volcano top*
… other data • for other data (e.g. for ‘full chemistry simulations’) it is recommended to use • EDGAR 3.2, 1995(NOx / anthropog. NMHC….)http:arch.rivm.nl/env/int/coredata/edgar • no specific recommendations are given for oxidant fields.
data access by anonymous ftp • ftp.ei.jrc.it … cd pub/Aerocom • subdirectories dust_ncf ( dust_small_ncf: 50% smaller dust ) seasalt_ncf DMS_ncf other_ncf_2000: other_ncf_1750: BC: bio-, fossil fuel, wildfireBC: biofuel, wildfire POM: bio-, fossil fuel, wildfire POM: biofuel, wildfire SO2: domestic, industry, powerplants, SO2: domestic, wildfire, off-road, road, -intern.shipping, wildfire, volcanic (continous and volcanic: continuous and explosive explosive SOA: secondary org. carbon SOA: sec. org. carbon an overview is provided in a power-point file(AEROYRMO.PPT) data can be made available on CD / DVD(contact kinne@dkrz.de)
Overview • BIOMASS BURNING • BIO FUEL / FOSSIL FUEL • SO2 • SO2 - volcanic contributions • SOA • DUST • SEASALT • DMS • EMISSION HEIGHTS • DATA ACCESS
Large scale biomass burningPOM (OC) / BC (EC) / SO2 YEAR 2000 • Global emissions (incl. large agricultural fires): based on GFED 2000 van der Werf, Gl.Ch.Bio, 2003, “Carbon emissions from fires in tropical ecosystems” * note: in AEROCOM: we use Particulate Organic Matter (POM) rather than organic carbon (OC) - 34.7Tg POM correspond to 24.8Tg OC http://www.gps.caltech.edu/~jimr/randerson.html • compare to: • T. BondPOM34.6 Tg,OC 25.05 Tg, BC 3.32 Tg ‘open burning’ • S. GenerosoPOM 29.3 Tg,BC 3.33 Tg(ACP, 2003) • EDGAR3.2(deforestion+savannah+mid-lat.burning)SO2 2.7 Tg
Large scale biomass burningPOM (OC) / BC (EC) / SO2 YEAR 1750 • Global emissions (incl. large agricultural fires) based on scaled GFED 1997-2002average • use present day land cover (Olson) • use 1750/1990 pop ratio (Hyde) • double hi-lat forest emission (Brenkert) • wet forest emission: scale by population • grassland and agricultural fires: 0.4 +0.6*(population ratio) * note: in AEROCOM: we use Particulate Organic Matter (POM) rather than organic carbon (OC): 12.8Tg POM equals 9.15Tg OC
size recommendationsfor primary SO4, OC and BC • particles size (log normal size-distributions) • industrial (fly ash)(for power plants) (larger sizes) • LN: r,mode = .500mm , std.dev = 2.0 (r,eff= 1.66mm) • biomass (for biomass and biofuel) • LN: r,mode = .040mm , std.dev. = 1.8 (r,eff= 0.095mm) (based on measurement close to biomass by Marelli, 2003) • traffic (for fossil fuel) • LN: r,mode = .015 mm , std.dev. = 1.8(r,eff= 0.036 mm) (based on kerbside [5 EU cities] by Putaud et al. 2003) http://carbodat.ei.jrc.it/ccu/main.cfm
Young aerosol Median diameter from lognorm. Fitting (nm)
fossil (bio-)fuel related emissionsPOM / OC / BCYEAR 2000 • based onSPEWTami Bond, JGR 2003 “A technology based global inventory of black and organic carbon emissions from combustion”(base year: 1996) • based onGEFDfor large scale open fires (… see above) * note: in AEROCOM: we use Particulate Organic Matter (POM) rather than organic carbon (OC): 3.2Tg POM equals 2.4Tg OC or9.1Tg POMequals6.5Tg OC note: these emissions are 35 % lower than those of a previous inventory, which was based on 1984 statistics
fossil (bio-)fuel related emissionsPOM / OC / BC YEAR 1750 • based on year 1890 CO biofuel inventory (J. Aardenne) • emission factors: BC .59, POM: 5.8, SO2: .27 (A. Andreae) • time-scaled with pop number ratio year1750 / year1890 (Hyde) • factor 2 scaling north of 45 degree N latitude * note: in AEROCOM: we use Particulate Organic Matter (POM) rather than organic carbon (OC): 2.5Tg POM equals 1.8Tg OC or12.8Tg POMequals9.1Tg OC
BC 2000 inventory comparisons • # 1 GWEM Hoelzemann • # 2 LSCE Generoso • # 3 GFED 2000 van der Werf
POM 2000 inventory comparisons • # 1 LSCE Generoso • # 2 GWEM Hoelzemann • # 3 GFED 2000 van der Werf
SO2 - emissions YEAR 2000 • global emissions from Janusz Cofala (IIASA) “Country based SO2 emissions for the year 2000 using RAINS, gridded according to EDGAR 3.2 (1995) distributions” • ship emissions assume a 1.5% /year increase since 1995 * a flat percentage of2.5%of all SO2 is emittedas primary SO4
SO2 - emissionsYEAR 1750 • reduced wildfire emissions (see biofuel section) • volcanic emissions as for the year 2000 (detailed description below) * a flat percentage of2.5%of all SO2 is emittedas primary SO4 (compare to 1-5% in literature)
SO2 – yr 2000 emissions by type decrease from 1990 to 1995 similar between EDGAR and IIASA - but IIASA+… 15 % lower than EDGAR (this is in good agreement to EMEP country emissions)
SO2 – 2000 emissions by region / type REGIONAL ESTIMATES: kg SO2 • Region Domestic_2 Industry_2 Intern. ship Off-road_2 Powerplant RoadTransp • OPEN OCEAN 0.00e+00 0.00e+00 5.05e+09 0.00e+00 0.00e+00 0.00e+00 • CANADA 7.16e+07 1.19e+09 2.90e+07 5.30e+07 5.44e+08 1.35e+07 • USA 3.11e+08 3.12e+09 8.45e+07 1.11e+08 1.25e+10 1.67e+08 • LATIN AMERICA 1.96e+08 2.96e+09 1.71e+08 1.99e+08 2.37e+09 2.98e+08 • AFRICA 3.95e+08 1.50e+09 2.54e+08 6.90e+07 2.56e+09 1.79e+08 • OECD EUROPE 4.42e+08 2.05e+09 1.64e+09 1.89e+08 3.47e+09 1.43e+08 • EASTERN EU 6.70e+08 1.01e+09 7.73e+07 3.63e+07 4.20e+09 2.96e+07 • CIS (old UdSSR) 1.16e+09 3.99e+09 0.00e+00 1.23e+08 5.61e+09 5.82e+07 • MIDDLE EAST 5.17e+08 2.44e+09 2.32e+08 6.30e+07 2.80e+09 2.48e+08 • INDIA REGION 5.95e+08 2.90e+09 1.93e+07 1.34e+08 3.49e+09 4.36e+08 • CHINA REGION 4.76e+09 1.47e+10 1.93e+07 3.45e+08 8.73e+09 1.24e+08 • EAST ASIA 3.50e+08 2.08e+09 1.26e+08 1.55e+08 1.09e+09 1.52e+08 • OCEANIA 8.30e+06 8.06e+08 7.24e+06 4.29e+07 8.50e+08 3.67e+07 • JAPAN 6.76e+07 4.79e+08 4.10e+07 4.09e+07 2.45e+08 3.71e+07 • WORLD 9.55e+09 3.92e+10 7.75e+09 1.56e+09 4.84e+10 1.92e+09 • total world 2000: 112.5 Tg (without volcanic contributions)
SO2 – volcanic emissions continuous erupting volcanos (Andres & Kasgnoc, JGR,1998) http://www.geiacenter.org ( GEIA data [next slide] aretoo small aGEIA valuesmultiplied by factor 1.2!) explosive erupting volcanoshttp://www.igac.noaa.gov/newsletter/22/sulfur.php
more to - volcanic emissions continuous partitioning a for more reading: • Graf et al: “The contribution of Earth degassing to the atmospheric sulfur budget” Chem. Geology, 147, 1998. • Halmer et al: “The annual volcanic gas input into the (upper) atmosphere: a global data set for the past 100 years” J. Volc. Geoth. Res., 115, 2002. the annual long-time average S emission recommend by GEIA of (8.4+2) Tg /year S is considered to be an underestimate a continuous S is multiplied by factor 1.5 !
SOA - secondary organicsorganic particles from the gas phase • a fixed fraction of 15% of natural terpene emission form SOA • SOA production is more complicated • emission estim. between 10 and 60Tg/year • 19.11 Tg /year POM SOA is formed on time scales of a few hours SOA emissions condense on pre-existing aerosol Time resolution is 12 months
Mineral Dust • global 1*1degree daily emission data • derive emission fluxes from log-normal size-distribution parameters (fields provided in monthly netcdf-files in the “/Dust_ncf” sub-directory) • assume a dust density of 2.5g/cm3 • contributions from two size modes based on year 2000 GSFC DAO surface winds Ginoux et al., JGR 102 3819-3830, 2001 (pag@gfdl.noaa.gov) Ginoux et al., Environ.M&S, 2004
Dust - Size Modes • Accumulation mode (0.1 to 1mm sizes) • Concentration /per grid-box * (mode2_number) • Mode radius (for number) (mode2_radius) • Standard deviation: 1.59 ( constant distribution width ) • Coarse mode (1 to 12 mm sizes) • Concentration /per grid-box * (mode3_number) • Mode radius (for number) (mode3_radius) • Standard deviation: 2.00 ( constant distribution width ) “/gridbox” to “/m2” conversion data provided in __.nc files ‘binflux.pro’(in /idl_binflux) calculates fluxes for any size bin (make sure to include radii as large as 25 mm to conserve mass)
Dustmass flux • monthly totals of daily fluxes
Dust - yearly average mass-flux 11% of mass flux is in the accumulation mode (acc) 89% of the mass flux is in the coarse mode (coa) 1.4% of mass flux is in the accumulation mode (acc) 98.6% of the mass flux is in the coarse mode (coa)