Download
1 / 21
210 likes | 320 Views
The U.S. Environmental Protection Agency (EPA) has proposed Draft PM2.5 Permit Modeling Guidance, intended for review by the modeling community. This guidance aims to clarify procedures surrounding PM2.5 compliance demonstrations and significant emissions rates (SER). The workshop held in Atlanta, GA, emphasized the importance of reliable air quality data and the complexities associated with modeling secondary PM2.5 formation. It includes recommendations for emissions inventories, background concentrations, and the necessary consultations between agencies. Feedback is encouraged beyond the comment period.

E N D
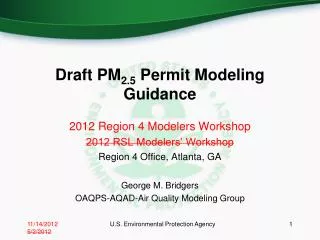
Draft PM2.5 Permit Modeling Guidance 2012 Region 4 Modelers Workshop 2012 RSL Modelers’ Workshop Region 4 Office, Atlanta, GA George M. Bridgers OAQPS-AQAD-Air Quality Modeling Group U.S. Environmental Protection Agency
Draft PM2.5 Permit Modeling Guidance • We still intend to release the Draft PM2.5 Permit Modeling Guidance in the near future for review and comment from the modeling community. • Discuss at 2012 R/S/L modelers workshop next week and release public review draft by mid-May... December 14th with final PM NAAQS rule. • The comments and feedback on the draft guidance are not directly connected to the 10th Modeling Conference and will be welcome after the comment period / Docket for the Conference have officially closed. U.S. Environmental Protection Agency
Draft PM2.5 Permit Modeling Guidance • The final rules governing the implementation of the NSR program for PM2.5 was promulgated on May 16, 2008. • Establishment of the Significant Emissions Rate (SER) for PM2.5 and for the PM2.5 Precursors which define the rates at which a net emissions increase will trigger major NSR permitting requirements. Any lower emissions increases are considered de minimis. • Direct PM2.5 SER = 10 tpy • PM2.5 Precursor – NOx = 40 tpy and PM2.5 Precursor – SO2 = 40 tpy • This rule also included a “grandfathering provision” that allowed applicants for federal PSD permits to continue relying upon the PM10 Surrogate Policy. • On February 11, 2010, the U.S. EPA published a proposal to repeal the grandfathering provision and an early end to the PM10 Surrogate Policy which occurred in May 2011 U.S. Environmental Protection Agency
Draft PM2.5 Permit Modeling Guidance • To assist sources and permitting authorities in carrying out the required air quality analysis for PM2.5 compliance demonstrations, a guidance memorandum entitled “Modeling Procedures for Demonstrating Compliance with PM2.5 NAAQS” was released on March 23, 2010. • Often referred to as the “Page Memo.” • Addressed interim procedures to address the probabilistic form of the NAAQS. • Acknowledged that there are technical complications associated with the ability of existing models to estimate the impacts of secondarily formed PM2.5. • Recommended special attention be given to the evaluation of monitored background air quality data since this data readily accounts for the contribution of both primary and secondarily formed PM2.5. U.S. Environmental Protection Agency
NACAA PM2.5 Modeling Implementation Workgroup • Formed in Spring of 2010 at the request of the U.S. EPA to provide technical recommendations to the agency to aid in further development of PM2.5 permit modeling guidance with focus on: • Emissions Inventories; • Secondary Formation from Project Source; and • Representative Background Concentrations • On January 7, 2011, a final report was shared with the U.S. EPA with a compilation of these efforts and recommendations. • This report is available for review on the 10th Modeling Conference web page on the SCRAM website: • http://www.epa.gov/ttn/scram/10thmodconf.htm U.S. Environmental Protection Agency
PSD Modeling of PM2.5: Screening Nature, Consultation, & Protocol • Given the potential contribution of secondary formation of PM2.5 (not explicitly accounted for by dispersion models) and prominent role of background concentrations in the cumulative impact analysis, certain aspects of standard modeling practices used for other criteria pollutants may not be appropriate. • As such, PSD modeling of PM2.5 should be viewed as screening-level analysis analogous to the screening nature of Section 5.2.4 of App W for NO2 impacts. U.S. Environmental Protection Agency
PSD Modeling of PM2.5: Screening Nature, Consultation, & Protocol • As stated in Section 5.2.2.1.c of Appendix W, the “[c]hoice of methods used to assess the impact of an individual source depends upon the nature of the source and its emissions. Thus, model users should consult with Regional Office to determine the most suitable approach on a case-by-case basis.” • A modeling protocol should be developed and approved by the EPA Regional Office, the state/local agency, and the applicant to ensure that the analysis conducted will conform to the recommendations, requirements, and principles of Appendix W Section 3.2.2. U.S. Environmental Protection Agency
PM2.5 Compliance Demonstration: Assessment Cases • Case 1: If PM2.5 emissions < 10 tpy and NOx & SO2 emissions < 40 tpy, then no PM2.5 compliance demonstration is required. • Case 2: If PM2.5 emissions > 10 tpy and NOx & SO2 emissions < 40 tpy, then PM2.5 compliance demonstration is required for direct PM2.5 emission based on dispersion modeling, but no analysis of precursor emissions from the project source is necessary. U.S. Environmental Protection Agency
PM2.5 Compliance Demonstration: Assessment Cases • Case 3: If PM2.5 emissions > 10 tpy and NOx &/or SO2 emissions > 40 tpy, then PM2.5 compliance demonstration is required for direct PM2.5 emission based on dispersion modeling, AND the applicant must account for impact of precursor emissions from the project source. • The assessment of the precursor emissions on the secondary formation of PM2.5 could be completely qualitative in nature, could be a hybrid qualitative / quantitative approach, or may be a full photochemical modeling exercise. • We anticipate that only a handful of situations would require explicit photochemical modeling. U.S. Environmental Protection Agency
PM2.5 Compliance Demonstration: Assessment Cases • Case 4: If PM2.5 emissions < 10 tpy and NOx &/or SO2 emissions > 40 tpy, then PM2.5 compliance demonstration not required for direct PM2.5 emissions, BUT the applicant must account for impact of precursor emissions from the project source similar to Case 3. and no analysis of precursor emissions from project source necessary (based on presumption that primary NO2 and SO2 NAAQS are controlling). • This case is still under review and consultation with the Policy Division and OGC. • Compliance with the NO2 and SO2 NAAQS are still required. U.S. Environmental Protection Agency
Modeling of Directly Emitted PM2.5 • Cases 2 & 3 both require compliance demonstration for the direct PM2.5 through dispersion modeling. • Typical significant impact and cumulative impact analysis approach. • Model Selection: • AERMOD, EPA’s preferred near-field dispersion model. • Model Considerations: • Modeling domain. • Source inputs. • Meteorological inputs. • Monitored background (cumulative impact analysis) U.S. Environmental Protection Agency
Assessment of Secondarily Formed PM2.5 • Case 3 is the only case that requires Both Case 3 and 4 require some level of assessment of precursor emissions from a new or modified source on the secondary formation of PM2.5. • As stated previously, the assessment of the precursor emissions on the secondary formation of PM2.5 could be completely qualitative in nature, could be a hybrid qualitative / quantitative approach, or may be a full photochemical modeling exercise. • Consultation with the EPA Regional Office is paramount, including the approval of a modeling protocol that includes a well constructed conceptual description of the PM2.5 for the region surrounding the project source. U.S. Environmental Protection Agency
Assessment of Secondarily Formed PM2.5 • Qualitative only approach: • Situations where precursor emissions levels are marginally higher than the level of the SERs, monitored background levels are very low, and the primary PM2.5 impacts are also very low such that the combination of the background and primary impacts are still well below the level of the NAAQS. • It is already a fair assessment that the primary PM2.5 and the secondarily formed PM2.5 concentrations will not be co-located in time and space. • Potentially augment with additional weight-of-evidence style discussion from recent SIP related photochemical modeling exercises in the region. • Recent Region 10 OCS drill ship permits are an example. U.S. Environmental Protection Agency
Assessment of Secondarily Formed PM2.5 • Hybrid qualitative / quantitative approach: • In most situations, background concentrations in addition to the primary PM2.5 impacts from the project source are already going to be relatively close to the NAAQS. • If a facility has sizable precursor emissions in such an environment, additional pseudo-quantitative analysis will be required beyond a weight-of-evidence style discussion. • The development of region specific offset ratios that can be applied to the precursor emissions to determine a related PM2.5 concentration is one option. • Other techniques such as the development of a PM2.5 Impacts Screening Tool based on region specific photochemical modeling could be explored. (Similar to the Environ Presentation on an ozone screening tool developed for Australia) U.S. Environmental Protection Agency
Assessment of Secondarily Formed PM2.5 • Chemical transport modeling: • As described in the NACAA PM2.5 Implementation Workgroup recommendations for their Tier III and Tier IV cumulative impact assessments, the use of a Lagrangian or Eulerian model may be required for very large sources with a tremendous net increase of PM2.5 precursor emissions. • We anticipate this being the rare case, especially in light of compliance requirements of the recently revised 1-hour NO2 and SO2 NAAQS. • The Lagrangian models (e.g., SCICHEM) are an emerging technical resource that could meet needs for assessment of secondarily formed PM2.5.(Discussed in greater detail at the 10th Modeling Conference by both EPA in terms of testing and evaluation and EPRI in terms of new release and open-source nature of code) U.S. Environmental Protection Agency
Assessment of Secondarily Formed PM2.5 • Chemical transport modeling: • The Eulerian models (e.g. CAMx & CMAQ) are widely used for SIP attainment modeling purposed but have limited application thus far for single source impacts.(Discussed in greater detail at the 10th Modeling Conference by EPA in terms of testing and evaluation ) • Several single source application techniques for the Eulerian photochemical models • Brute Force “Zero-Out” • Source Apportionment Techniques • Direct Decoupled Method (DDM) • Sub-Grid Treatment • Please note there are still a number of outstanding issues to resolve regarding use of photochemical models for single-source assessments U.S. Environmental Protection Agency
Monitored Background (Cumulative Impact) • Representative background monitored concentrations of PM2.5 will entail different considerations from those for other criteria pollutants. • Monitored background PM2.5 concentrations: • Should account for the contribution of secondary PM2.5 formation associated with existing sources represented in the modeling domain. • Consideration should be given to the potential for double-counting the impacts from modeled emissions that may be reflected in the background monitoring • Likely not as important for secondary contributions. • There could be some issues if the monitor is located relatively close to a nearby source of primary PM2.5. U.S. Environmental Protection Agency
Monitored Background (Cumulative Impact) • It may be appropriate to account for seasonal variation in background PM2.5 levels which may not be correlated with seasonal patterns of the modeled primary PM2.5 levels. • Primary PM2.5 of fugitive or low-level emission sources likely occur during winter months due to longer periods of stable atmospheric conditions. • Maximum levels of secondary PM2.5 (in the eastern U.S.) typically occur during the spring and summer months due to high levels of sulfates. • Relative composition of PM2.5 and temporal patterns associated with the highest daily PM2.5 levels may differ significantly from that associated with the annual average PM2.5 levels, especially in western states. U.S. Environmental Protection Agency
Comparison to the PM2.5 NAAQS • Combining the modeled and monitored concentrations of PM2.5 for comparison to the NAAQS also entails considerations different from those for other criteria pollutants. • The probabilistic form of the PM2.5 NAAQS requires additional careful considerations. • The representative monitored PM2.5 design value should be used as a component of the cumulative analysis rather than the overall maximum monitored background concentration. • Annual PM2.5 design value is based on a 3-year average of the annual average PM2.5 concentrations. • Daily PM2.5 design value is based on the 3-year average of the 98th percentile 24-hour average PM2.5 concentrations. • 8th highest based on 365 daily samples in a year. • Reference Appendix N to 40 CFR Part 50 for other ranks. U.S. Environmental Protection Agency
Questions and Comments • George M. Bridgersbridgers.george@epa.gov919-541-5563 • Tyler Foxfox.tyler@epa.gov919-541-5562 U.S. Environmental Protection Agency