Download

1 / 13
140 likes | 255 Views
This document explores the accuracy, spatial, and temporal representation of PM2.5 monitoring through various sources, including measured data, chemical transport models (CTMs), and remote sensing. It highlights the importance of in-situ measurements in validating models and discusses the development of networks like SPARTAN to enhance global air quality coverage. The paper reviews a range of monitoring techniques and emphasizes the need for better algorithms and models to improve the representation of aerosol and air quality processes.

E N D
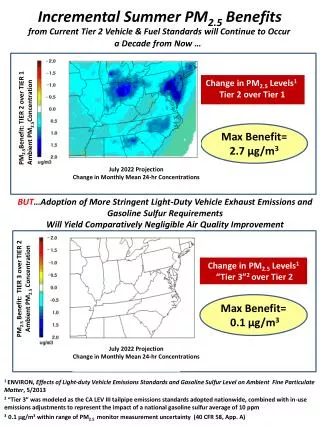
Monitoring and Modelling of PM2.5 Aaron van Donkelaar and Randall Martin October 4, 2012
Introduction Three important questions: • How accurate is it? • How spatially representative is it? • How temporal representative is it? Three sources of information: • Measured • Chemical Transport Models • Remote Sensing
Measured observations are essential • Most direct and accurate data source • Essential for validation Network dependent • Data accessibility • Site density • Collection method/standard • Site selection criteria
The SPARTAN network is developing to increase global in-situ coverage • Location Criteria • High population density • Proximity to AERONET (AOD) observations • Uncertainty in PM2.5 concentrations • Strong Potential • Publically available • Globally consistent • Highly relevant for satellite-derived PM2.5
Chemical Transport Models (CTM) allow continuous, global coverage • Year-specific emissions • Dust, sea salt, sulfate-ammonium-nitrate system, organic carbon, black carbon, SOA • Detailed aerosol-oxidant chemistry • Resolution of 100’s x 100’s km • Numerous tracers, 100’s reactions • Assimilated meteorology
CTM accuracy varies by region • Accuracy due to impact of: • Local emission inventories • Regionally relevant chemical reactions • Meteorology • Able to test impact of emissions using case studies Within NA: r =0.87 slope = 1.26 bias = -3.14 μg/m3 Outside NA: r = 0.63 (0.71) slope = 0.51 (0.56) bias = 8.51 (2.75) μg/m3 GEOS-Chem v8-01-04
Satellite retrievals give total aerosol column …but look through the entire atmosphere down to the surface Satellite retrievals rely on the same principles as surface visibility… Beijing Aug 13, 2008PM10 = 12 μg m-3 Loss of contrast Increased reflectance Aug 18, 2008PM10= 278 μg m-3 BBC Gangetic River Valley, India
The aerosol column is related to PM2.5 We relate satellite-basedretrievals of aerosol optical depth(τ) to PM2.5 using a global chemical transport model • MISR • Multi-angle • 4 bands • 6-9 day coverage Estimated PM2.5 = η· τ GEOS-Chem Chemical Transport Model vertical structure ▪ aerosol type ▪ meteorological effects ▪ • MODIS • Single viewpoint • 36 bands • daily coverage van Donkelaar et al. Environ. Health Perspect. 2010 Atmos Environ. 2011 8
Significant agreement with coincident ground measurements over NA Annual Mean PM2.5 [μg/m3] (2001-2006) Satellite Derived Satellite-Derived [μg/m3] In-situ In-situ PM2.5 [μg/m3]
Satellite-derived PM2.5 shows global agreement Outside Canada/US N = 244 (84 non-EU) r = 0.83 (0.83) Slope = 0.86 (0.91) Bias = 1.15 (-2.64) μg/m3 CTM Agreement: r = 0.63 (0.71) slope = 0.51 (0.56) bias = 8.51 (2.75) μg/m3 • Accuracy impacted by • Representation of surface brightness • Simulated aerosol vertical profile • Sampling affected by cloud cover and snow
A Combined PM2.5/NO2 Indicator from Satellite 150 75 0 PM2.5 [μg/m3] PM2.5 Eastern China 15 7.5 0 Shanghai Beijing Delhi Karachi Seoul Cairo Lima Tehran Los Angeles Berlin Moscow Nairobi MPI [unitless] NO2 25 15 5 0 1 2 5 7 9 11 13 15 Satellite-Based Multipollutant Index (Unitless) 0 4 8 12 PM2.5 [μg/m3] MPI *Satellite-based surface NO2 concentrations can be estimated using a CTM to relate the column to surface quantities similar to satellite-derived PM2.5. Moscow 2.5 1.5 0.5 MPI [unitless] Cooper et al., EHP, 2012
Remote sensed, modelled and measured PM2.5 each improve global monitoring Future Work Remote Sensing: Improved algorithms to increase accuracy and resolution Modelling: Develop representation of processes Develop assimilation capability to inform AOD/PM2.5 Measurements: More needed for evaluation throughout the world Acknowledgements Health Canada NSERC NASA