Download
1 / 26
260 likes | 368 Views
Explore the intertwining relationship between public transport and cities in South Africa. Uncover the impact of city growth, urban sprawl, and transport accessibility on residents' quality of life and economic development. Learn how decentralization can improve transportation efficiency and sustainability. Discover solutions for sustainable urban mobility in the context of economic development and social well-being.

E N D
GUIDELINES FORPASSENGER TRANSPORT IN SOUTH AFRICAA MULTI MODAL ANALYSIS CHAPTER 2 CITIES AND ECONOMIC DEVELOPMENT
2.1 Introduction • Public transport and cities are deeply interwoven. • Cities create the conditions for public transport to function effectively (should) • public transport enables all citizens - particularly those who do not have access to cars - to enjoy access to all the activities which cities offer
2.1 Introduction cont’ • This chapter will therefore describe the reasons for city growth and draw attention to the undesirable consequences of urban “sprawl” on the quality of life of all urban residents.
2.2 Transport and City Development Johannes F Linn (1983:87-88) • The basic function of urban transport is therefore to link residence and employment, producers and users of goods and services
2.2 Transport and City Development cont’ • The accessibility of an urban neighbourhood determines to a considerable extent whether or at least how easily: • solid waste is collected; water, sewerage, drainage and • electricity networks are provided and maintained, • police and fire protection is made available and • schools and health care are within reach of urban dwellers.
2.2 Transport and City Development cont’ • the poor are at the margin of subsistence and are especially sensitive to disruption in their earnings brought about by poor transport policies. • Improved access to transport for neighbourhoods can improve the • employment prospects of the poor, • reduce the money and time spent on getting to jobs, • reduce the costs of inputs for their small scale enterprise activities, and • increase access to markets for their products. • It also facilitates the provision of access to all the other public services in poor areas.”
2.3 City Structure and Transport (a) Centralised cities • Centralisation produces: • high travel intensities for passenger movement, • and high land values • Criticism is being directed at the narrow streets (old roads made to serve light traffic which must now carry the heavy commercial and industrial traffic of an urban region) and the lack of parking spaces around the centre where most workers make a living.
2.3 City Structure and Transport cont’ • The labour force depends on a highly developed system of public and private transportation which is difficult to provide in Centralised • LDC’s (less developed countries) - where the infrastructural and economic base of such cities is inadequate to cope with the problems created by excessive size, of which traffic congestion is one.
(a) Centralised cities cont’ • It is a dilemma that is “choking” many cities in terms of the movement of people and goods within the cities with extremely serious consequences of : • waste of resources (time and energy of people, fuel) and • harmful effects on the productivity of the city’s economic base.
2.3 City Structure and Transport cont’ (b) Decentralised cities • The extensive use of land far from the central area and the construction of detached single family homes on the periphery (edge) of the city led to an increase in traffic volumes. • The higher incomes of the residents in these areas resulted in higher car ownership per household and consequently in more congestion and longer delays.
(b) Decentralisedcities cont’ • Less centralised cities are therefore faced with the problems of: • longer journey distances, which not only add to vehicle operating costs but also to the volume of traffic and • the requirement for transport facilities to carry the traffic
(b) Decentralisedcities cont’ • South Africa cities are surrounded by “urban sprawl” which places them to a large extent in the “decentralised city” category • Example for solving: the provision of “corridors” should be undertaken in large cities which require higher performance transportation. • To achieve this there is a need for fully controlled ways (right-of-way A and right-of-way B) with considerable advantages such as lower operating costs, capacity, and speed
2.4 Public Transport for Sustainable Mobility • The MCD (millennium cities database) enables users to assess the performances of their city and their transport network, as measured via 230 indicators.
2.4.1 The high cost of urban sprawl and car dependency • The demographic growth of cities has been accompanied by a considerable expansion of urbanized areas. • The consequences of urban sprawl are well-known: break-up of social ties between neighbours, car dependency, longer journeys, increase in transport spending, traffic congestion and environmental deterioration.
2.4.2 Public transport is more economical and eco-friendly than the car • The MCD provides elements for comparing automobile and public transport performances: • per passenger x km transported, public transport is more economical than the car once density is higher than 20 inhabitants per hectare. • Public transport consumes 4 times less energy per person transported. • Lastly surface public transport uses road space far more efficiently than the car.
2.4.2 Public transport is more economical and eco-friendly than the car cont’ • The MCD makes it possible to highlight the conditions for successful public transport: • ease of access on foot to public transport as well as PT’s (public transport) speed and regularity are vital conditions if it is to compete successfully with the car,
2.4.2 Public transport is more economical and eco-friendly than the car cont’ • the most attractive and efficient public transport networks serve dense conurbations (an extended urban area )and chiefly use dedicated rail modes, • limiting the number of parking spaces in city centres is an important tool in a policy for sustainable mobility and public transport prioritization: • cities in which public transport is used by large numbers of people provide few parking spaces in their centres.
2.4.2 Public transport is more economical and eco-friendly than the car cont’ • In Sandton, for example, only 5% of the population uses public transport, while in Soweto the percentage is 55%. • In other words, SA cities reflect a mixture of Houston as well as Hong Kong!
2.4.2 Public transport is more economical and eco-friendly than the car cont’ • The consequences of urban sprawl” are therefore, almost entirely negative. • To summarise, urban “sprawl” [unchecked spreading of a city or its suburbs/the expansion of low-density development] leads to: • higher transport costs to the community • a lower market share for public transport • higher rates of car ownership
2.4.2 Public transport is more economical and eco-friendly than the car cont’ • higher energy consumption per inhabitant • higher accident rates and fatalities • longer journey times for public transport users • low levels of public transport service • low public transport speeds • more parking space required
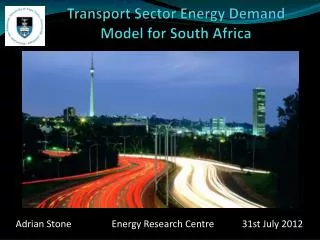
2.5 Oil depletion and energy usage • present rates of oil consumption may start to outstrip the rate of production within the foreseeable future • peak production of oil worldwide will occur around 2015 to 2020 (Gilbert and Perl : 169) and will decline after that.
2.5 Oil depletion and energy usage • If consumption of oil continues to grow at the same rate as the last thirty years or so, there will be an imbalance between supply and demand that will drive oil prices up to unacceptably high levels. • This will severely impact on transport, which uses about 60% of the world’s oil
2.5 Oil depletion and energy usage cont’ • Gilbert and Perl suggest that all countries critically examine their oil consumption and take steps to reduce their dependence on it. • They recommend a number of actions, including the following: • a reduction of 40% in oil consumption • a far greater emphasis on public transport, rail transport and electric traction (using renewable sources) • return to “grid-connected” electric vehicles such as trolley buses and trolley lorries
2.6 Rural Areas and Transport • Remember that many residents of rural areas experience problems, which in many cases are more severe than those of urban dwellers. • These problems include inadequate infrastructure, poor quality of facilities, low levels of income and so on. • Those most affected are children, women, the elderly and the infirm.
2.6 Rural Areas and Transport cont’ • Severe difficulties are experienced in reaching shopping facilities, clinics, schools, and pension payout points. • Unless these aspects are addressed, it can be expected that the drift of people to the cities will continue as rural dwellers seek a higher quality of life. • This will merely place more pressure on available urban resources, with possible negative consequences for the economy.