Download
1 / 12
120 likes | 243 Views
Transport Sector Energy Demand Model for South Africa. Adrian Stone Energy Research Centre 31st July 2012. Introduction. Work Commissioned by SANEDI SA Transport sector 28 % of TFC. The

E N D
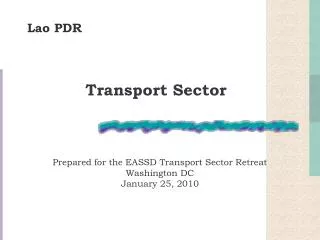
Transport Sector Energy Demand Model for South Africa Adrian Stone Energy Research Centre 31st July 2012
Introduction • Work Commissioned by SANEDI • SA Transport sector 28% of TFC. The • Bulk (97%) is liquid fuels. This is 84% of national liquid fuel demand. (DoE, 2009)(IEA, 2011). • Medium to long term (2050) future trends in demand for passenger transportation - different scenarios • Medium to long term future trends in demand for freight transportation - different scenarios. • Resulting demand for energy in scenarios. • CO2 emissions associated with each of the scenarios? Transport Sector Model
Systems Dynamics Considerations Source: Armenia, Baldoni, Falsini, & Taibi, 2010 Transport Sector Model
Multi-Model Solution Base Year Time Budget Model Calibrated Vehicle Parc Model Baseline P-km, T-km/ Mode-share 3 Income Groups: • Average km/h • Public/private split WIDER CGE Model Projected Income of Household Deciles 2005 - 2030 Energy Demand Future Year Time Budget Model Projected P-km Mode-share ANSWER TIMES Model Future FE Assump. Transport Sector Model
Baseline – The Vehicle Parc Model Scrapping Factor NAAMSA Vehicle Sales Vehicle Parc Model Enatis Check Vehicle Mileage/Decay Vehicle km Occupancy P-km, T-km/ Mode-share Fuel Consumption Fuel Economy/ Improvement Natmap/SOL Check SAPIA/EB Check Transport Sector Model
Mileage Decay Still a Guess Transport Sector Model
TBM – The Gospel According to Victor & Schafer Transport Sector Model
TBM – Simple Principle PKM = Total Passenger.km per year Fij = Fraction in motion on mode j by income group i. Sj = Average Speed of mode j Ti = Travel Time Budget per person per year for income group i Nij = Number of people in income group i using mode j Transport Sector Model
TBM – Salient Assumptions Transport Sector Model
TBM – Refinements • TBM balances Vehicle Parc Model but Average Speeds seem v. low • Even after adjusting mileage & occupancy in the VPM • Philip G. measured 41 km/h in Jhb in extensive study • Maybe giving way slightly on 1.1 hour justified Transport Sector Model
Freight Model – Balances Fuel but Poor Agreement with the SOL Transport Sector Model
Some Results Transport Sector Model