Download

1 / 45
480 likes | 792 Views
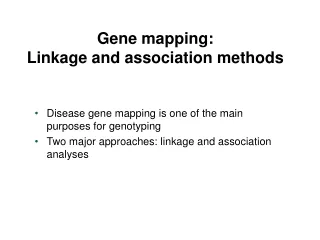
Association Mapping. David Evans. Outline. Definitions / Terminology What is (genetic) association? How do we test for association? When to use association HapMap and tagging Genome-wide Association Sequencing and Rare variants. Definitions. Locus: Location on the genome.

E N D
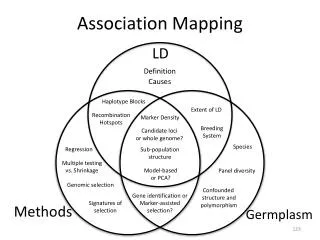
Association Mapping David Evans
Outline • Definitions / Terminology • What is (genetic) association? • How do we test for association? • When to use association • HapMap and tagging • Genome-wide Association • Sequencing and Rare variants
Definitions Locus: Location on the genome SNP: “Single Nucleotide Polymorphism” a mutation that produces a single base pair change in the DNA sequence alleles A A C T A alternate forms of a SNP (mutation) C G C A T genotypes A A C T A both alleles at a locus form a genotype C G C A T haplotypes A A C T A the pattern of alleles on a chromosome C G C A T QTL: “Quantitative trait locus” a region of the genome that changes the mean value of a quantitative phenotype
What is (genetic) association? Correlation between an allele/genotype/haplotype and a trait of interest
Genetic Association Three Common Forms • Direct Association • Mutant or ‘susceptible’ polymorphism • Allele of interest is itself involved in phenotype • ~70% of Cystic Fibrosis patients have a deletion of 3 base • pairs resulting in the loss of a phenylalanine amino acid • at position 508 of the CFTR gene
Genetic Association Three Common Forms • Direct Association • Mutant or ‘susceptible’ polymorphism • Allele of interest is itself involved in phenotype • ~70% of Cystic Fibrosis patients have a deletion of 3 base • pairs resulting in the loss of a phenylalanine amino acid • at position 508 of the CFTR gene • Indirect Association • Allele itself is not involved, but a nearby correlated • variant changes phenotype
Linkage Disequilibrium Linkage disequilibrium means that we don’t need to genotype the exact aetiological variant, but only a variant that is correlated with it
Genetic Association Three Common Forms • Direct Association • Mutant or ‘susceptible’ polymorphism • Allele of interest is itself involved in phenotype • Indirect Association • Allele itself is not involved, but a nearby correlated • marker changes phenotype • Spurious association • Apparent association not related to genetic aetiology • (e.g. population stratification)
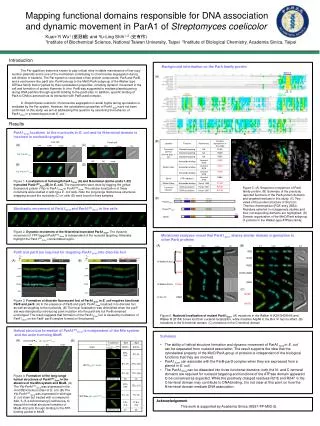
Population Stratification Marchini, Nat Genet. 2004
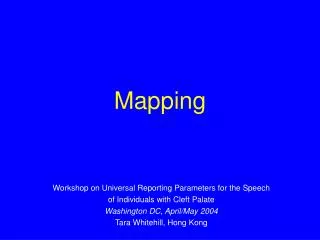
Genetic Case Control Study Controls Cases G/G G/T T/T T/T T/G T/G T/T T/T T/G G/G T/G T/G T/G T/T Allele Gis ‘associated’ with disease
Each individual contributes two counts to 2x2 table. Test of association where X2 has χ2 distribution with 1 degrees of freedom under null hypothesis. Allele-based tests
SNP marker data can be represented in 2x3 table. Test of association where X2 has χ2 distribution with 2 degrees of freedom under null hypothesis. Genotypic tests
Simple Regression Model of Association (Unrelated individuals) Yi = a + bXi + ei where Yi = trait value for individual i Xi = number of ‘A’ alleles an individual has 1.2 1 0.8 Y 0.6 0.4 0.2 0 X 0 1 2 Association test is whether b > 0
Transmission Disequilibrium Test • Rationale: Related individuals have to be from the same population • Compare number of times heterozygous parents transmit “A” vs“C” allele to affected offspring AC AA AC
Transmission Disequilibrium Test • Difficult to gather families • Difficult to get parents for late onset / psychiatric conditions • Inefficient for genotyping (particularly GWA) AC AA AC
Case-control versus TDT p = 0.1; RAA = RAa = 2
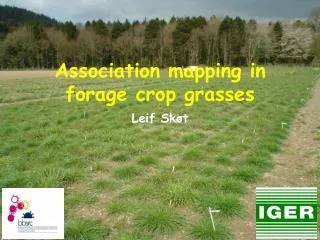
Methods of gene hunting rare, monogenic (linkage) Effect Size common, complex (association) Frequency
Families or unrelateds Matching/ethnicity crucial Many markers req for genome coverage (105 – 106 SNPs) Powerful design Ok for initial detection; good for fine-mapping Powerful for common variants; rare variants difficult Association Summary
Historical gene mapping Glazier et al, Science (2002).
Linkage Marker Gene1 Linkage disequilibrium Mode of inheritance Linkage Association Gene2 Complex Phenotype Individual environment Gene3 Common environment Polygenic background Reasons for Failure? Inadequate Marker Coverage (Candidate gene studies) Weiss & Terwilliger (2000) Nat Genet
G/C 3 G/A 2 T/C 4 G/C 5 A/T 1 A/C 6 G G A A G G G T T G G A C C C C C C C C C C C C A A A A T T G G G C C C high r2 high r2 high r2 Pairwise tagging Tags: SNP 1 SNP 3 SNP 6 3 in total Test for association: SNP 1 SNP 3 SNP 6 Carlson et al. (2004) AJHG 74:106
Enabling Genome-wide Association Studies HAPlotype MAP High throughput genotyping Large cohorts
Genome-wide Association Studies The Australo-Anglo-American AnkylosingSpondylitis Consortium (2010) Nature Genetics
Meta-analysis Repapi et al. (2009) Nature Genetics
Imputation Recombination Rate 1 1 0 1 1 0 1 0 1 1 0 1 1 0………. 1 1 0 1 1 0 1 0 1 1 0 1 1 0………. HapMap Phase II 1 1 0 1 1 0 1 0 1 1 0 1 1 0………. 1 1 0 1 1 0 1 0 1 1 0 1 1 0………. 2 1 1 2 ? 2 1 ?? 1 ? 2 2 0………. 2 1 1 2 ? 2 2 ?? 0 ? 2 1 0………. Cases 2 ? 1 2 ? 2 1 ?? 1 ? 1 1 0………. 2 1 2 1 ? 2 2 ?? 1 ? 1 1 0………. 2 1 1 1 ? 2 1 ?? 1 ? 2 2 0………. 2 1 1 1 ? 2 2 ?? 0 ? 2 2 0………. Controls 1 0 1 2 ? 2 1 ?? 1 ? 1 1 ?………. 2 1 2 1 ? 2 2 ?? 1 ?1 1 ?……….
2 Stratification adjust test statistic Genomic control 2 No stratification Test locus Unlinked ‘null’ markers
Replication Replication studies should be of sufficient size to demonstrate the effect The same SNP should be tested The replicated signal should be in the same direction Replication studies should conducted in independent datasets Joint analysis should lead to a lower p value than the original report Replication should involve the same phenotype Replication should be conducted in a similar population Well designed negative studies are valuable
Programs for performing association analysis • Mx (Neale) • Fully flexible, ordinal data • Not ideal for large pedigrees or GWAs • PLINK (Purcell, Neale, Ferreira) • GWA • Haploview (Barrett) • Graphical visualization of LD, tagging, basic tests of association • MERLIN, QTDT (Abecasis) • Association and linkage in families
Analysis of Rare Variants • How to combine rare variants? • “Ordinary” tests of association won’t work • Collapse across all SNPs? • Which SNPs to include? • Frequency? • Function? • How to define a region?
Genetic association studies can be used to locate common genetic variants that increase risk of disease/affect quantitative phenotypes Genome-wide association spectacularly successful in identifying common variants underlying complex traits and disease The next challenge is to explain the “missing heritability” in the genome. Genome-wide sequencing and the analysis of rare variants will play a major part in this effort Summary