Download
1 / 1
10 likes | 110 Views
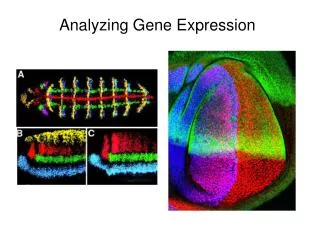
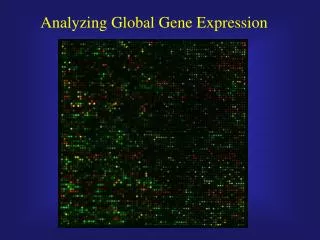
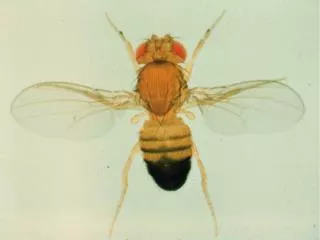
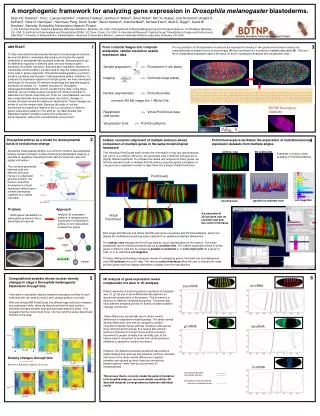
Computational analysis of gene expression at cellular resolution in Drosophila melanogaster blastoderms to understand developmental regulatory networks and spatial complexity. Techniques for quantifying gene expression and visualizing data in 3D embryo morphology. Exploration of gene expression patterns reveals morphodynamic changes indicating a need for a new approach. Dive into the PointCloudXplore tool to analyze multidimensional expression datasets from various angles.

E N D
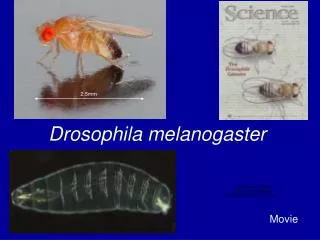
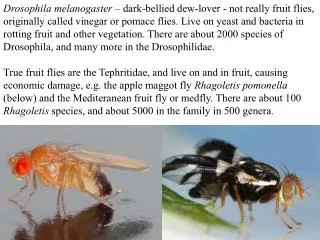
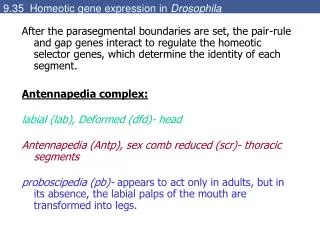
A morphogenic framework for analyzing gene expression in Drosophila melanogaster blastoderms. Soile V.E. Keränen1, Cris L. Luengo Hendriks1, Charless Fowlkes2, Gunther H. Weber3, Oliver Rübel4, Min-Yu Huang3, Clara N. Henriquez1, Hanchuan Peng, Lisa Simirenko1, Damir Sudar1, Bernd Hamann3, Jitendra Malik2, Michael Eisen1, Mark D. Biggin1, David W. Knowles1, Berkeley Drosophila Transcription Network Project. Lawrence Berkeley National Laboratory, Berkeley, CA. 2) Department ofElectrical Engineering andComputer Science, UC Berkeley, Berkeley, CA. 3) Institute for Data Analysis and Visualization (IDAV), UC Davis, Davis, CA 4) University of Kaiserslautern, Kaiserslautern, Germany ABSTRACT To fully understand the developmental basis of morphological evolution, we must be able to computationally analyze and model the spatial complexity of developmental regulatory networks. Because genes can be differently regulated in different cells, we must measure gene expression at cellular resolution. Because gene regulation depends on intercellular communication, we also need to map the relative positions of the cells in whole organisms. Drosophila melanogaster is a common model for studying mechanisms of developmental pattern formation. To compare the expression patterns of multiple genes, we have developed techniques for extracting 3D embryo morphology and quantifying gene expression at cellular (i.e., nuclear) resolution in Drosophila melanogaster blastoderms, and for visualizing the data. Using these methods, we can measure gene expression at nuclear resolution in blastoderms of whole fixed embryos. From our novel datasets, we have also computationally discovered complex a/p and d/v changes in nuclear densities around the embryonic blastoderm. These changes are similar to our live embryo data. Because the scale of nuclear movements are significant relative to the x,y,z locations of different genes' expression patterns in the embryo, our data indicate that blastoderm pattern formation needs to be analyzed in a morphodynamic, rather than a morphostatic environment. D V D PointCloudXplore A P Density changes through time (A anterior, P posterior, D dorsal, V ventral) 3 1 From confocal images into computer analyzable, cellular resolution spatial expression data The xyz-positions of the blastoderm nuclei and the expression intensity of two genes around each nucleus are computationally extracted from a confocal image (A) and converted into a computer readable data table (B). This text-file of compressed expression data is the basis for all the subsequent analyses and visualization tools. Sample preparation >> Fluorescent in situ stains Imaging >> Confocal image stacks Nuclear segmentation >> PointCloud data converts 300 Mb image into 1 Mb text file Registration >> Virtual PointCloud data (see below) Visualization tools >> PointCloudXplore id,x,y,z,Nx,Ny,Nz,Da,Db,Vn,Vc,eve,ftz,hb,kni,kr,rho,slp1,sna,tll,croc,fkh,twi,trn,gt ****** 1009,142.45,124.288,38.4751,-0.2286,0.37424,-0.89871,0,0,317.559,864.635,13.7058,81.2576,14.1843,21.9375,4.9696,7.9223,10.912,6.5325,18.3249,17.3787,18.499,10.9727,38.7896,80. 2018,159.302,123.878,164.709,-0.10815,0.3775,0.91967,0,0,308.755,865.85,70.6029,10.0973,25.2076,17.8543,8.8861,33.3451,13.8321,58.1229,17.7753,27.252,20.3735,70.5197,10.4731,2 3027,111.273,115.159,158.502,-0.23647,0.3794,0.8945,0,0,268.984,685.818,12.2596,5.7213,8.0693,69.3157,6.614,28.261,70.3689,58.5122,15.6545,22.3175,15.5599,63.354,45.7422,40.88 4036,341.931,30.2893,75.7972,0.18502,-0.94545,-0.26812,0,0,231.338,537.361,19.9463,53.7362,65.8337,21.3702,8.2404,19.4855,8.0923,5.6487,25.3556,18.5914,22.0013,10.0438,22.6887 5045,168.5,25.747,67.1179,-0.10967,-0.90025,-0.42134,0,0,224.052,630.261,51.517,8.0767,22.2996,23.0654,11.2735,46.5546,12.3596,5.6873,15.8975,24.598,25.5458,9.9865,16.8356,20. 6054,119.682,108.526,168.746,-0.19491,0.21631,0.95667,0,0,170.923,505.484,67.6004,6.7196,10.9492,24.8757,7.5595,58.568,66.6675,36.9671,23.4779,15.9494,18.4064,59.0062,17.4559, 1,175.229,155.285,55.1238,-0.14639,0.80211,-0.57896,0,0,285.682,582.293,10.2466,89.2554,23.3279,18.3,10.1307,16.224,13.789,5.0749,15.5772,21.7618,22,15.5339,34.8946,16.5044 ... BDTNP Bioimaging Database 2 4 Drosophila embryo as a model for developmental basis of evolutionary change Cellular resolution alignment of multiple embryos allows comparison of multiple genes in the same morphological framework PointCloud explore facilitates the exploration of multidimensional expression datasets from multiple angles Drosophila melanogaster embryo is a common model in developmental biology. Its basic bodyplan is determined during blastoderm stage by a cascade of regulatory interactions that read the maternal inputs into spatial information. embryo view 3D scatterplot The individual PointClouds each contain the information of only two gene products per cell for one embryo. Moreover, the equivalent cells in different embryos are in slightly different positions. To compare the spatial and temporal of many genes, we find the equivalent cells in multiple PointClouds by using the spatial information of one gene as a registration marker to align them into a single Virtual PointCloud. Examples of various views available in PointCloudXplore This converts genetically identical cells into different cell types. Hence, to understand genome function, we need to record the development of local expression differences in a whole developing organism at a cellular resolution. PointClouds cell magnifier parallel co-ordinate view unrolled view Problem Approach A screenshot of 3D surfaces over an unrolled view and two control interfaces Analyze 3D expression patterns of multiple genes expressed in a blastoderm embryo to find interactions between the genes ~14000 genes translated in a selforganizing manner into a stereotypical organism Virtual PointCloud Both single PointClouds and Virtual PointClouds can be visualized with PointCloudXplore, which can display the multidimensionsal expression data both on spatial and abstract dimensions. The embryo view displays the PointCloud data as visual representation of the embryo. The whole blastoderm can be viewed simultaneously as an unrolled view. The relative expression levels of all the genes in different cells can be viewed as parallel co-ordinates or in a 3D scatter plot for a group of cells, or in an individual cell magnifier. To better distinguish between expression levels of overlapping genes, the levels can be displayed as novel 3D surfaces over a 2D view. The various control interfaces allow the user to choose the views and the genes and their display intensities to display from the total data set. input edge node network output 6 5 Computational analysis shows nuclear density changes in stage 5 Drosophila melanogaster blastoderm through time 3D analysis of gene expression reveal complexities not seen in 1D analyses ftz mRNA eve mRNA Pattern elements of anterior-posterior regulators of bodyplan eve, ftz, gt, hb and kr show differential development on dorsal and ventral sides of the embryo. This movement is different for different elements and genes. The genes also have different temporal profiles for anterior-posterior pattern changes (not shown). These differences are partially due to dorso-ventral differences in blastoderm morphogenesis. The dorso-ventral density differences (see left) are caused by nuclear movement towards denser patches. Because embryos are three-dimensional structures, this causes also anterior-posterior movement of nuclei. Since anterior-posterior movement is greater dorsally than ventrally, part of the higher anterior movement of dorsal than ventral posterior elements is caused by nuclear movement However, the difference between predicted late positions (black stippled line) and real late positions (red line) indicates that some of the dorso-ventral differences in pattern formation are caused by direct inductive interactions between genes, rather than as a by-product of morphogenesis. This proves that to correctly model the pattern formation in Drosophila embryos, we need cellular resolution 3D data and temporal correspondences between individual nuclei. If we want to accurately map the temporal expression profiles of each individual cell, we need to know if cells change position over time. We have divided 896 PointClouds into different age cohorts to measure any expression shifts, when we discovered that the local nuclear densities increase dorsally (red) and decrease anteriorly (blue). This suggests that the nuclei must move. Our live cell time series data shows that this is the case. gt mRNA hb mRNA kr mRNA early border position: late border position: late border position projected from cell movement alone: