Download
1 / 24
240 likes | 384 Views
Gene expression is regulated at multiple levels, from DNA transcription to protein localization. Understanding how transcription influences gene expression is crucial, as it reflects steady-state mRNA levels, RNA stability, and alternative splicing. Assays such as in situ hybridization require careful consideration of probe specificity and RNA accessibility. Methods like fluorescence microscopy and live imaging allow for the observation of protein dynamics and interactions in real-time, enhancing our understanding of molecular mechanisms. This comprehensive overview discusses the intricacies of gene expression pathways.

E N D
Question: How much of “gene expression” is controlled by transcription?
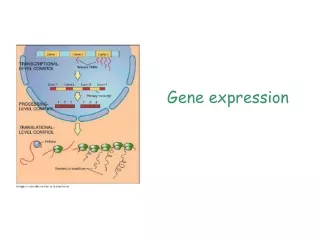
Mother Nature Controls Gene “Expression” at EVERY Level DNA Transcription Alternative Splicing RNA Stability RNA Localization RNA Translation Protein Stability Protein Modification Protein Localization Protein-Protein Interaction Protein
Rule #1: Think about what your assay measures What does in situ hybridization measure? Steady State [mRNA]: Production [mRNA] degradation Does this pattern reflect transcriptional control or RNA stability? Which alternative splice forms are you detecting? What might affect probe hybridization and your ability to measure it?
Example: the story of nanos nanos bcd wt nos unlocalized nos RNA mutant nanos RNA is 52% anterior, 48% posterior!
Rule #2: Think about how your assay affects your results Sample Preparation -How does fixing, sectioning and staining affect your RNA or protein? -How does GFP-tagging your protein affects its normal distribution? -How does culturing/microscopy affect live sample (e.g. phototoxicity)? Specificity -How specific are your probes for what you want to detect? -How can you determine what is background and what is signal? Detection -What fraction of your RNA or protein is accessible to your probe? -What is your threshold for detection of your RNA/protein? Are amounts below this threshold still biologically significant?
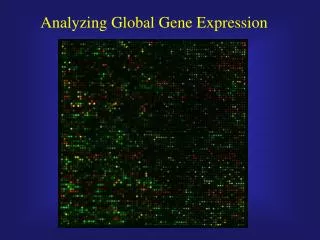
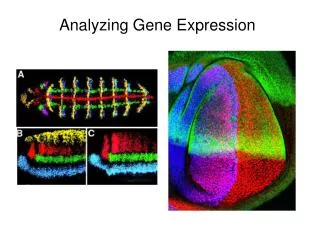
Steady State RNA Levels: In situ Hybridization Dave Kosman et al. PMID: 17923096 H. Krause and colleagues
Detecting promoter activity Approaches -lacZ or GFP “knock in” -promoter fusions -enhancer traps Pros -Can be more sensitive than in situ -Can be imaged over time (live) -Can image more tissues (easier or no fixation) Cons -Doesn’t reflect endogenous RNA or protein distribution -Promoter fusions can lie
Detecting 3’UTR Control (e.g. RNA stability and miRNA regulation)
Steady State Protein Levels: Immunostaining http://www.kcl.ac.uk/depsta/biomedical/randall/methods/im-fluo.html
pMAD Modification-specific Antibodies Can Reveal Protein Activity D Side view V Dpp RNA Dorsal view Dpp RNA Dorsal view Some Examples: -Phospho-specific -Modified Histones -Cleaved (active) Caspase
GFP-type FP’s have a chromophore that matures autocatalytically Both the chromophore structure and amino acid environment affect properties PMID: 18721746
A Whole Spectrum of Fluorescent Proteins PMID: 18721746
Photo-activatable and Photo-shifttable Fluorescent Proteins PMID: 19002208
In vivo RNA Localization Fluorescent MS2 Coat Protein Stau-GFP grk-MS2 bcd-MS2 bcd-MS2 nos-MS2
In vivo Protein Localization Par-2-GFP
Studying Protein Dynamics FRAP: Fluorescence Recovery After PhotoBleaching FLIP: Fluorescence Loss In PhotoBleaching
Studying Protein-Protein Interaction Fluorescence Resonance Energy Transfer Interaction partners fused to different FPs that form an energy transfer pair BioMolecular Fluorescence Complementation Interaction partners fused to different domains of single FP which only fluoresces when two domains unite
Fluorescence Correlation Spectroscopy Examining the behavior of a limited number of molecules in a small volume By correlating fluctuations in fluorescence can gain insight into molecular properties Can be done by confocal on live cells Correlate fluorescence with time: determine rate of motion, residence times, particle size Correlate fluorescence in neighboring volumes: determine directionality of motions Correlate fluorescence of MULTIPLE labeled species: determine molecular interactions (e.g. protein-protein)
Imaging Other Molecules Invitrogen
Imaging Technology is Constantly Changing -TIRF (Total internal Reflection Fluorescence) Microscopy -”Super-resolution” Microscopy -Fluorescence Correlation Spectroscopy -Single Molecule Fluorescence microscopy