Download
1 / 27
290 likes | 682 Views
Principles of Microeconomics 10. Introduction to Market Failures*. Akos Lada August 4th, 2014. * Slide content principally sourced from N. Gregory Mankiw “Principles of Economics” Premium PowerPoint. Contents. Review of previous lecture Externalities Policy solutions to externalities.

E N D
Principles of Microeconomics10. Introduction to Market Failures* AkosLada August 4th, 2014 * Slide content principally sourced from N. Gregory Mankiw “Principles of Economics” Premium PowerPoint
Contents • Review of previous lecture • Externalities • Policy solutions to externalities
P PB PS Q The effect of a Tax CS = A PS = F A Tax revenue = B + D S B C Total surplus= A + B + D + F E D D F Deadweight loss C + E QT QE
Elasticities and Deadweight loss • The size of the deadweight loss is determined by the elasticity of supply and demand of a good. • The more elastic the Supply or the Demand of a good is, the larger the deadweight loss. • The less elastic the Supply or the Demand of a good is, the smaller the deadweight loss. • This is very informative for the decision of “What products to tax?”.
Introduction • In absence of market failures, the competitive market outcome is efficient, maximizes total surplus. • One type of market failure: externality, the uncompensated impact of one person’s actions on the well-being of a bystander. • Externalities can be negative or positive, depending on whether impact on bystander is adverse or beneficial. • Self-interested buyers and sellers neglect the external costs or benefits of their actions, so the market outcome is not efficient. • In the presence of externalities, public policy can improve efficiency.
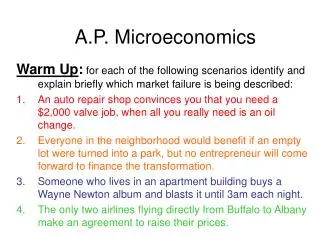
Examples of Negative Externalities Air pollution from a factory The neighbor’s barking dog Late-night stereo blasting from the dorm room next to yours Noise pollution from construction projects Health risk to others from second-hand smoke Talking on cell phone while driving makes the roads less safe for others
Recap of Welfare Economics The market for gasoline P $ 5 4 3 $2.50 2 1 0 Q(gallons) 25 0 10 20 30 The market equilibrium maximizes consumer + producer surplus. Supply curve shows private cost, the costs directly incurred by sellers. Demand curve shows private value, the value to buyers (the prices they are willing to pay).
Private vs. Social gains and losses • If all the agents affected by the outcomes of a market (e.g. buyers, sellers, and government) participate in the decisions of that market, then the (total) private gains and losses from trade are the same as the social gains and losses of trade. • However, if there are agents affected by the market but who don’t participate in the decisions that lead to market outcomes (e.g. by-standers), then the (total) private gains and losses are not necessarily equal to the social gains and losses from trade in that market.
The Social Cost curve The market for gasoline P $ 5 external cost 4 3 2 1 0 Q(gallons) 0 10 20 30 (Marginal) social cost= private + external cost Supply ( marginal private cost) External cost = value of the negative impact on bystanders = $1 per gallon(value of harm from smog, greenhouse gases)
The Socially Optimal Quantity The market for gasoline P $ 5 4 3 2 1 0 Q(gallons) 0 10 20 30 The socially optimal quantity is 20 gallons. Social cost S At any Q < 20, value of additional gas exceeds social cost. At any Q > 20, social cost of the last gallon isgreater than its value to society. D 25
Consequences of a Negative Externality The market for gasoline P $ 5 4 3 2 1 0 Q(gallons) 0 10 20 30 Market equilibrium (Q = 25) is greater than social optimum (Q = 20). Social cost S One solution: tax sellers $1/gallon, would shift S curve up $1. D 25
“Internalizing the Externality” • Internalizing the externality: altering incentives so that people take account of the external effects of their actions • In our example, the $1/gallon tax on sellers makes sellers’ costs = social costs. • When market participants must pay social costs, market equilibrium = social optimum. (Imposing the tax on buyers would achieve the same outcome; market Q would equal optimal Q.)
Examples of Positive Externalities Being vaccinated against contagious diseases protects not only you, but people who visit the salad bar or produce section after you. R&D creates knowledge others can use. People going to school raise the population’s education level, which reduces crime and improves government.
Positive Externalities • In the presence of a positive externality, the social value of a good includes • private value – the direct value to buyers • external benefit – the value of the positive impact on bystanders • The socially optimal Q maximizes welfare: • At any lower Q, the social value of additional units exceeds their cost. • At any higher Q, the cost of the last unit exceeds its social value.
P 50 $ 40 30 20 10 Q 0 0 10 20 30 STUDENTS’ TURN:Analysis of a positive externality The market for flu shots External benefit = $10/shot • Draw the social value curve. • Find the socially optimal Q. • What policy would internalize this externality? S D
P 50 $ external benefit 40 30 20 10 Q 0 0 10 20 30 25 Answer The market for flu shots Socially optimal Q = 25 shots. To internalize the externality, use subsidy = $10/shot. S Social value = private value + $10 external benefit D
If negative externality market quantity larger than socially desirable If positive externality market quantity smaller than socially desirable To remedy the problem, “internalize the externality” tax goods with negative externalities subsidize goods with positive externalities Effects of Externalities: Summary
Public Policies Toward Externalities Two approaches: • Command-and-control policies regulate behavior directly. Examples: • limits on quantity of pollution emitted • requirements that firms adopt a particular technology to reduce emissions • Market-based policies provide incentives so that private decision-makers will choose to solve the problem on their own. Examples: • corrective taxes and subsidies • tradable pollution permits
Corrective Taxes & Subsidies • Corrective tax: a tax designed to induce private decision-makers to take account of the social costs that arise from a negative externality • Also called Pigouvian taxes after Arthur Pigou (1877-1959). • The ideal corrective tax = external cost • For activities with positive externalities, ideal corrective subsidy = external benefit
Example of a Corrective Tax: The Gas Tax The gas tax targets three negative externalities: • CongestionThe more you drive, the more you contribute to congestion. • AccidentsLarger vehicles cause more damage in an accident. • PollutionBurning fossil fuels produces greenhouse gases.
Corrective Taxes & Subsidies • Other taxes and subsidies distort incentives and move economy away from the social optimum. • Corrective taxes & subsidies • align private incentives with society’s interests • make private decision-makers take into account the external costs and benefits of their actions • move economy toward a more efficient allocation of resources.
Corrective Taxes vs. Regulations • Different firms have different costs of pollution abatement. • Efficient outcome: Firms with the lowest abatement costs reduce pollution the most. • A pollution tax is efficient: • Firms with low abatement costs will reduce pollution to reduce their tax burden. • Firms with high abatement costs have greater willingness to pay tax. • In contrast, a regulation requiring all firms to reduce pollution by a specific amount not efficient.
Tradable Pollution Permits • A tradable pollution permits system reduces pollution at lower cost than regulation. • Firms with low cost of reducing pollution sell whatever permits they can. • Firms with high cost of reducing pollution buy permits. • Result: Pollution reduction is concentrated among those firms with lowest costs.
Tradable Pollution Permits in the Real World • Sulfur Dioxide (SO2) permits traded in the U.S. since 1995. • Nitrogen oxide permits traded in the northeastern U.S. since 1999. • Carbon emissions permits traded in Europe since January 1, 2005. • As of June 2008, Barack Obama and John McCain each propose “cap and trade” systems to reduce greenhouse gas emissions.