Download

1 / 18
180 likes | 203 Views
Explore how cosmic-ray muons are affected by thunderstorms in Moscow using the URAGAN muon hodoscope detector from NEVOD. This study analyzes the muon flux variations during storm events in Summer 2009. The data processing methods and meteorological correlations provide valuable insight into atmospheric disturbances. Enhance your understanding of elementary particle acceleration with this scientific investigation.

E N D
National Research Nuclear University MEPhI Thunderstorms and Elementary Particle Acceleration , September 6-11, 2010 Analysis of muon flux response for thunderstorm events in Moscow region A.S. Mikhaylenko, N.V. Ampilogov, N.S. Barbashina, A.N. Dmitrieva, K.G. Kompaniets, A.A. Petrukhin, D.A. Timashkov, N.V. Tolkacheva, V.V. Shutenko, I.I. Yashin Scientific and Educational Centre NEVOD
Cosmicray muons Detector Cosmicray muons are elementary particles with high penetrating power, the flux of which is formed in the upper atmosphere under the action of primary cosmic radiation and is sensitive to changes in the basic thermodynamic parameters of the atmosphere. Therefore, any disturbances in the atmosphere, in particular, storms, modulate the flux of muons at the Earth's surface, which makes it possible to investigate these disturbances with the help of muon detectors.
Muon hodoscope URAGAN Muon hodoscope URAGAN, created in the Scientific and Educational Center NEVOD (MEPhI), is a multi-layer coordinate-tracking detector. Hodoscope is capable of simultaneously recording muons from different directions in a wide range of zenith angles for study of spatial-angular characteristics of muon flux variations. The angular accuracy of track reconstruction in the detectoris betterthan 1. Мeasurements on the URAGAN began in 2005, the total time of its operation is more than 30 thousand hours.
Muon hodoscope URAGAN • URAGAN consists of four modules, the total area of 46 m2, which are recording and processing ~ 5500 muons per second. • Each module is an eight-layer assembly of gas-discharge chambers, equipped with two-coordinate system of external pickup strips. • Every minute URAGAN gathers data on angular distribution of muon flux and writes them in a special structure - the matrix. • During the experiment, approximately 2 million martices were collected, containing unique information about the spatial and angular variations of cosmic-ray muons.
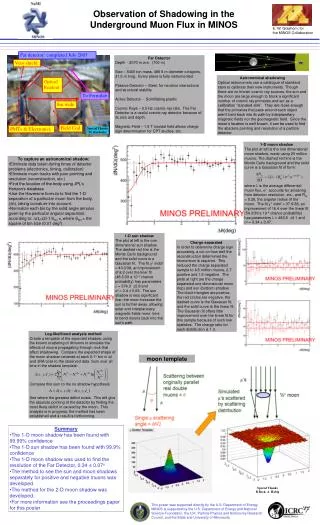
Matrices of muon flux • 2D-matrix: • registration time = 1 minute; • average counting rate ~ 1700 s-1(about 105 muons/min); • angular matrix of 90x90 cells; • statistical errors of ~ 0.1%(for 10-minute interval). Data processing: • averaging • normalization • Fourier filtering
Methods of muon hodoscopedata processing As the quantitative characteristics reflecting the distortion of the angular distribution of muon flux, the following parameters are used: • Vector of local anisotropy (A) - indicates the average direction of arrival of muons recorded by the detector. This value is calculated as the sum of unit vectors, each of them has a direction, obtained by the reconstruction of the track in an individual event, normalized to the number of events. For the analysis, the values of anisotropy vector modulus and two projections of this vector onto horizontal plane - South (AS) and East (AE) – are used. • The vector of relative anisotropy (r) - the difference between the local vector of anisotropy in the current time interval and anisotropy vector averaged for a long time period. For the analysis, its projection on the horizontal plane (rh) is used. r = A - <A>
Meteorological data • In order to obtain the most complete picture of the thunderstorm activity in the period May-August 2009, several sources of data have been used, each of them served to indirectly test the others. • The main criterion of the presence of the storm event was characteristic pressure peak, which in meteorology is called "thunderstorm nose." “thunder nose” Counting rate, % Atmospheric pressure, mbar July 14-15, 2009 • During the Summer 2009, in Moscow there were 20 thunderstormdisturbances, for the 12 most powerful of them (the power was estimated from the height of " thunderstorm nose") data from URAGANwere processed andanalyzed.
Dependence of counting rate deviation on the height of the “thunderstorm nose” Counting rate deviation, in units Height of the “thunderstorm nose”, mbar
Thunderstormof May 12,2009 “thunderstorm nose"
“thunderstorm noses” Thunderstormof July 14,2009
Conclusion • Analysis of the muon hodoscope data for thunderstorm events of Summer 2009 showed that in 9 of 12 events the reaction in total muon counting rate was observed.In the set of the considered angular characteristics of the flux variations, the response was observed in all events. • Thus, it is confirmed that the flux of muons is sensitive to local storm disturbances. The results indicate promising perspectives of cosmic rayapplication as a tool for remote monitoring of the local atmospheric phenomena. • The work was performed in the Scientific and Educational Centre NEVOD witn the support of the Federal Target Program “Scientific and pedagogical cadres for innovative Russia”.
Матрицы-кадры потока мюонов • 2D-матрицы: • регистрация 1 минута • средний темп счета 1700 Гц • (около 105мюон / мин) • угловая матрица 90x90 ячеек • статистические ошибки ~0.1% (для 10-минутногоинтервала) Обработка данных: • усреднение • нормировка • фурье-фильтрация