Download
1 / 98
980 likes | 1.15k Views
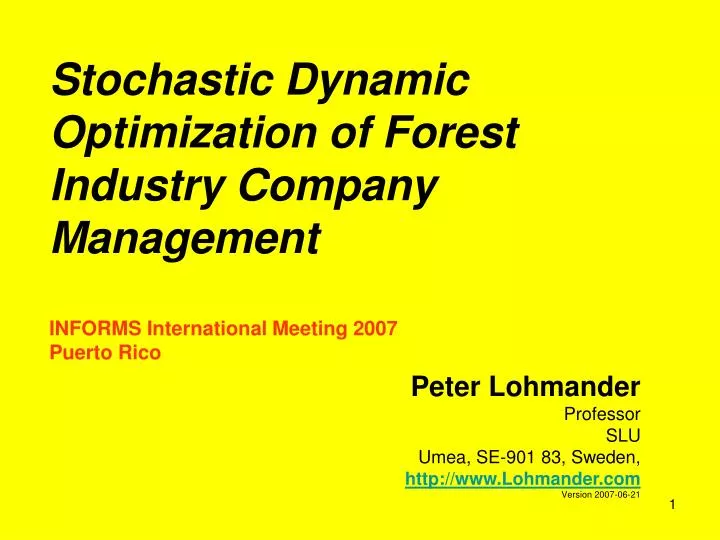
Stochastic Dynamic Optimization of Forest Industry Company Management INFORMS International Meeting 2007 Puerto Rico. Peter Lohmander Professor SLU Umea, SE-901 83, Sweden, http://www.Lohmander.com Version 2007-06-21. Abstract.

E N D
Stochastic Dynamic Optimization of Forest Industry Company ManagementINFORMS International Meeting 2007Puerto Rico Peter Lohmander Professor SLU Umea, SE-901 83, Sweden, http://www.Lohmander.com Version 2007-06-21
Abstract • Forest industry production, capacity and harvest levels are optimized. • Adaptive full system optimization is necessary for consistent results. • The stochastic dynamic programming problem of a complete forest industry company is solved. The raw material stock level and the main product prices are state variables. In each state and at each stage, a linear programming profit maximization problem of the forest company is solved. Parameters from the Swedish forest industry are used as illustration.
Question How should these activities in a typical forest industry company be optimized and coordinated in the presence of stochastic markets? *Pulp, paper and liner production and sales, *Sawn wood production and sales, *Raw material procurement and sales, *Harvest operations *Transport
Approach in three stages • A typical forest industry company is defined using real mills and forest conditions in the North of Sweden. • For each year (or other period) and possible price and stock state, the variable company profit is maximized using linear programming. (Quadratic programming etc. are other options.) • The expected present value of the company over an infinite horizon is maximized via stochastic dynamic programming in Markov chains.In this stage, a standard LP solver is used.
Optimization of the variable profit during a year:Linear programming codeBackground: http://www.lohmander.com/SkogIndEk1/SI1.html
! SMB2; ! Peter Lohmander 2003-10-15; Max = TProf; TProf = - InkK - IntKostn + ForsI; InkK = PKTi*KTimmer + PKMav*KMav + PKFlis*KFlis + PReturpL*KReturpl + PReturpI*KReturpI; IntKostn = AvvK*Avv + TPKostTI*ETimmer + TPKostMA*EMav + CSV*ProdSV + CLiner*ProdLin; ForsI = PSV*ProdSV + PLiner*ProdLin + PSTi*STimmer + PSMav*SMav + PSFlis*SFlis; !Market prices of raw material and raw material constraints; PKTi = 380; PSTi = 330; PKMav = 200; PSMav = 120; PKFlis = 250; PSFlis = 150; PReturpL = 50; PReturpI = 730; [LRetP] KReturpL <= 100;
!SMBs forest and harvesting; AvvK = 70; AvvKap = 570; TimAndel = .5; [KapAvv] Avv <= AvvKap; !Roundwood transport costs; TPKostTI = 60; TPKostMa = 70; !SMBs saw mill; PSV = 1500; CSV = 300; SVKap = 80; TTimmer = ETimmer + KTimmer; ProdSV = .5*TTimmer; ProdFl = .8*ProdSV; ProdSp = .2*ProdSV; [KapSV] ProdSV <= SVKap;
!SMBs raw material balance; EMav = (1-TimAndel)* Avv - SMav; ETimmer = Timandel*Avv - STimmer; EFlis = ProdFl - SFlis; !SMBs liner mill; PLiner = 4900; CLiner = 1200; LinerKap = 400; TRetP = KReturpL + KReturpI; TFiber = EMav + EFlis + KMav + KFlis; ProdLin = .25*TFiber + .95*TRetP; [FFiberK] TFiber/TRetP >= 4; [KapLiner] ProdLin <= LinerKap; end
Optimization of the variable profit during a year:Optimal results
Local optimal solution found at step: 10 Objective value: 1373354. Variable Value Reduced Cost TPROF 1373354. 0.0000000 INKK 236846.2 0.0000000 INTKOSTN 563850.0 0.0000000 FORSI 2174050. 0.0000000 PKTI 380.0000 0.0000000 KTIMMER 160.0000 0.0000000 PKMAV 200.0000 0.0000000 KMAV 471.5128 0.0000000 PKFLIS 250.0000 0.0000000 KFLIS 0.0000000 50.00000 PRETURPL 50.00000 0.0000000 KRETURPL 100.0000 0.0000000 PRETURPI 730.0000 0.0000000 KRETURPI 105.1282 0.0000000 AVVK 70.00000 0.0000000 AVV 570.0000 0.0000000
TPKOSTTI 60.00000 0.0000000 ETIMMER 0.0000000 10.00000 TPKOSTMA 70.00000 0.0000000 EMAV 285.0000 0.0000000 CSV 300.0000 0.0000000 PRODSV 80.00000 0.0000000 CLINER 1200.000 0.0000000 PRODLIN 400.0000 0.0000000 PSV 1500.000 0.0000000 PLINER 4900.000 0.0000000 PSTI 330.0000 0.0000000 STIMMER 285.0000 0.0000000 PSMAV 120.0000 0.0000000 SMAV 0.0000000 10.00000 PSFLIS 150.0000 0.0000000 SFLIS 0.0000000 50.00000 AVVKAP 570.0000 0.0000000 TIMANDEL 0.5000000 0.0000000 SVKAP 80.00000 0.0000000
TTIMMER 160.0000 0.0000000 PRODFL 64.00000 0.0000000 PRODSP 16.00000 0.0000000 EFLIS 64.00000 0.0000000 LINERKAP 400.0000 0.0000000 TRETP 205.1282 0.0000000 TFIBER 820.5128 0.0000000
Row Slack or Surplus Dual Price LRETP 0.0000000 680.0000 KAPAVV 0.0000000 160.0000 KAPSV 0.0000000 600.0000 FFIBERK 0.6043397E-09 -788.9547 KAPLINER 0.0000000 2915.385