Download
1 / 8
90 likes | 639 Views
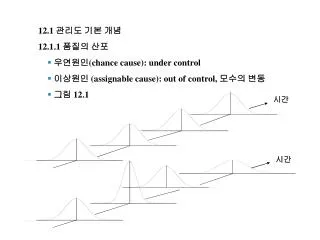
12.1 관리도 기본 개념 12.1.1 품질의 산포 우연원인 (chance cause): under control 이상원인 (assignable cause): out of control, 모수의 변동 그림 12.1. 시간. 시간. 12.1.2 관리도란 ? 1924 년 W.A. Shewhart in Bell Lab. KS A 3201:2001 우연원인 산포와 이상원인 산포를 구분하기 위하여. 관리하한 LCL. 관리상한 UCL. 12.1.3 관리도의 종류

E N D
12.1 관리도 기본 개념 • 12.1.1 품질의 산포 • 우연원인(chancecause): under control • 이상원인 (assignablecause): out of control, 모수의 변동 • 그림 12.1 시간 시간
12.1.2 관리도란? • 1924년 W.A. Shewhart in Bell Lab. • KS A 3201:2001 • 우연원인산포와 이상원인 산포를 구분하기 위하여 관리하한 LCL 관리상한 UCL
12.1.3 관리도의 종류 • (1) 계수형관리도 (control chart for attribute) • 부적합품률 (p) 관리도 • 부적합품수 (np) 관리도 • 부적합수 (c) 관리도, 단위당 부적합수 (u) 관리도 • (2) 계량형관리도 (control chart for variable) • 평균값 관리도 • 범위 (R) 관리도
12.1.4 관리한계선 RejectH0 LCL AcceptH0 UCL RejectH0
12.1.5 부분군(시료군, subgroup)의 형성 • 부분군의크기 n이 클수록 공정의 작은 변화를 더 민감하게 탐지 • 공정의 이동 폭이 적을 수록 n을 크게 • 부분군의 채취빈도가 높을수록 공정변화를 민감하게 탐지 • 12.1.6 관리상태의 판정 • Under Control: • 점이관리한계선을 벗어나지 않을 때 • 점의 배열에 아무런 습성이 없을 때 • 런 (run)의 길이가 긴 경우 • 경향(trend)이 있는 경우 • 주기성 (cycle)이있는경우 • 점이 관리한계선에 접근하여 여러 개 나타나는 경우 • 층화현상 (stratification)이 나타나는 경우
12.2 부적합품률 (p) 관리도 • 공정 부적합률 p 가 일정하게 유지되는 연속 생산공정 (무한모집단)에서 n개의 시료를 추출할 경우 • n개의 시료 중 부적합품의개수 X=x일확률:
12.2 부적합품률 (p) 관리도 (계속) • i 번째 subgroup 의 부적합률 pi: • 예제 12.2
12.2.3 p관리도의 OC 곡선 • p값의 변화에 따라 시료의부적합률이 관리한계선 안에 있을 확률: • 예제 12.3 • 12.3 부적합품수 (np) 관리도