Download
1 / 34
340 likes | 443 Views
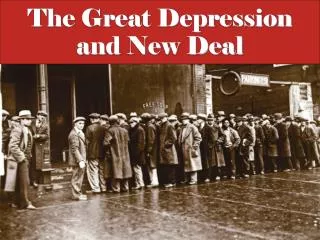
The Great Economic Unraveling of 2008-2010: Impacts on the U.S. and Texas. Bernard L. Weinstein, Ph.D. Cox School of Business Southern Methodist University Presentation to Chapter 13 Consumer Bankruptcy Seminar Arlington, Texas November 9, 2009. Madoff New York Mag.

E N D
The Great Economic Unraveling of 2008-2010: Impacts on the U.S. and Texas Bernard L. Weinstein, Ph.D. Cox School of Business Southern Methodist University Presentation to Chapter 13 Consumer Bankruptcy Seminar Arlington, Texas November 9, 2009
Delinquent Mortgages by Type of Loan Source: Wall Street Journal
Taking Shelter Source: Wall Street Journal
Top 5 States Underwater Top states where home mortgage holders in selected markets owed more than their property was worth at the end of June: Sources: First American CoreLogic
S&P/Case-Shiller Home Price Index Change in home prices in July 2009 compared with a year earlier. Sources: Standard & Poor’s; Fiserv
Household Net Worth Source: New York Times
Real Economic Growth Gross domestic product 2Q 2009: -0.7% 2005 2006 2007 2008 ’09 Source: Commerce Department
Nonfarm Payrolls Monthly change, in thousands Sept ’09: -263,000 2007 2008 2009 Source: Labor Department
U. S. Jobless Rate Sept. ’09: 9.8% In percent, seasonally adjusted: 2008 2009 Source: U.S. Department of Labor
Retail Sales Total retail sales in billions of dollars, seasonally adjusted. Sept. 2009: $345.8 billion 2008 2009 Source: U.S. Commerce Department
Personal Consumption In trillions Aug 2009: $10.2 trillion 2008 2009 Source: U.S. Department of Commerce; Bureau of Economic Analysis
Industrial Production Index, 2002=100, seasonally adjusted Sept. 2009: 97.5 Source: Federal Reserve Board
Construction Spending In billions of dollars, seasonally adjusted Aug 2009: $941.9 billion 2008 2009 Source: Commerce Department
Housing Starts New private housing starts during the month, in thousands, at seasonally adjusted annual rates. Sept. Starts:590,000 2008 2009 Source: Dept. of Commerce; Dept. of H.U.D.; Census Bureau
Consumer Prices Percentage change, month to month (seasonally adjusted) Aug. 2009: 0.2% 0 0 0 0 2008 2009 Source: Bureau of Labor Statistics
Budget Deficit In billions of dollars 2007: -$163 billion 2008: -$454 billion 2009 Estimate: -$1.4 trillion 2010 Projected: -1.2 trillion Source: Office of Management and Budget, White House projections
Unemployment Rate, U. S., Texas, & D/FW U. S. Sept. 2009 = 9.8% Texas Aug. 2009 = 8.0% D/FW Aug. 2009 = 8.2% U. S. & Texas Seasonally Adjusted *D/FW not Seasonally Adjusted Source: Texas Workforce Commission
Employment Change 2004-2007 Source: Texas Workforce Commission
DFW MSA Projected Population 2005-2040 By Race/Ethnicity and Migration Scenario* Source: Texas State Data Center *.5 Scenario
Major Threats to Texas Economy • Unstable Energy Prices • Drop in Defense Spending • Lower US Exports • Falling State and Local Tax Receipts
Crude Oil and Natural Gas Prices: 2006-2009 Crude Oil: West Texas Intermediate Spot Average (Dollars per barrel) Natural Gas: Henry Hub Spot (Dollars per thousand cubic feet) Source: Energy Information Administration, Bloomberg.com
Trends in State Government Revenues In Billions Source: Comptroller of Public Accounts
Consumer Confidence Index From a monthly survey of 5,000 U. S. households, 1985 = 100 Sept. 2009: 53.1 2008 2009 Source: The Conference Board
Leading Indicators Index of 10 indicators designed to “lead,” or predict overall economic activity; 2004 = 100. Aug 2009: 102.2 2007 2008 2009 Source: The Conference Board
Savings Rate Personal Savings as a Percentage of Disposable Personal Income Aug 2009: 3.0% 2007 2008 2009 *May & June savings pattern influenced by Economic Stimulus Act of 2008. Source: Commerce Department, Bureau of Economic Analysis