Download
1 / 71
710 likes | 732 Views
Interaction models for the propagation of the e.m.f. in biological systems Francesca Apollonio, Micaela Liberti, Guglielmo d’Inzeo. ICEmB at Department of Electronic Engineering, University "La Sapienza" of Rome E-mail: dinzeo@uniroma1.it. Physical Law. Na. K.

E N D
Interaction models for the propagation of the e.m.f. in biological systems Francesca Apollonio, Micaela Liberti, Guglielmo d’Inzeo ICEmB at Department of Electronic Engineering, University "La Sapienza" of Rome E-mail: dinzeo@uniroma1.it
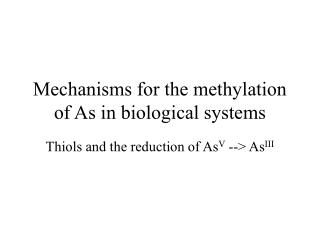
Physical Law Na K
Polarization Effects • Electronic and Atomic polarization nearly instantaneous • (Resonant in the visible range) • Dipolar polarization (Debye): • Water (t =10-12) g • Big globular proteins (t = 10-6) b • Counter-ions diffusion (t = 10-4 ) a
Mobile phone and Head |H|2/|HMAX|2 0 0.2 0.4 0.6 0.8 1
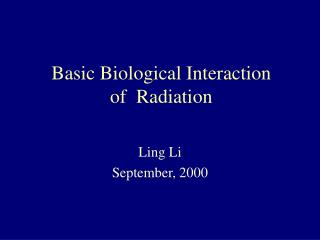
Tissue Absorption SAR as a function of e” o DT/Dt SAR = w e e”E2/r [W/kg] = s E2/r r = mass density [kg /m3] Termoregulation? Skin sensors?
150 V/m 100 V/m 100 V/m 50 V/m SARpeak = 1.5 W/kg SARpeak = 2.0 W/kg Exposure and Absorption Example
Field Distribution [mW/cm2] [mW/cm2] [W/kg] 510-3 10-3 10-4 10-5 10-6 (SAR) distribution Power distribution in presence of the exposed subjecy Plane-wave power distribution
Exposure (SAR, DT) Induced SAR and DT f = 900 MHz, Prad = 600 mW
Chiabrera & d’Inzeo 1993
WHERE?? k12 k12 k23 k23 S + E ES E + P S + E ES E + P Enzymatic reactions in external environment: kiEM fields k21 k32 k32 k21 + + + + - + + + - + - - - - - + - Product in extracellular space (i.e. free ions) Ligand [ ] & motion EM fields Binding of ions on their specific receptors in membrane Binding EM fields Ionic fluxes through the cell membrane I ions EM fields Cell to cell interaction Communication EM fields K+ Na+ Ca++ + + + + + + + + + + + + + + + + + + + + + Enzymatic reactions in cytoplasm, linked to internal processes: Cell functions EM fields The cell and its environment - - - - - - - - - - - - - - - - - - - - - - K+ Na+ Ca++
Proposed Methodology Effects on Physiological Parameters (e.g. Vm, ISI) EM Field Source Membrane Model Internal EM Field Effects on single channel currents Single Ionic Channel Model Microscopic EM Field Effects on ion binding probability Ligand Ion Receptor Site Model Local Microscopic EM Field
D • [30 ÷0.01] m f [10 ÷30000] MHz D [3 ÷50] mm l >> D Quasi Statical Condition Laplace Equation: 2V=0 RF Microdosimetry
D • [10 ÷0.01] mm f [30 ÷30000] GHz D [3 ÷50] mm l ”@ D Full wave approach 2V + k2V= 0 THz Dosimetry
II level Three Strates Sphere: - extracellular Medium - membrane - citoplasm Homogenous Sphere: First Approximation Level III level Five Strates Sphere : - extracellular Medium - external Bound water - membrane - internal Bound water - citoplasm Full Model: Five Strates Sphere + Involved cellular compartments IV level
Cytoplasmatic medium k Cytoplasmatic layer of bound water z y B y E x Cell membrane Extracellular layer of bound water x Microscopic Dosimetric Evaluation • The Model: • multilayered sphere • incident plane wave • Solved with Mie theory Results: Alta frequenza, Vol 11, n 3, 1999
MEMBRANE: percent variation at different angular positions
e2 e1 emix 2V+ k2V=0 + Boundary conditions for D at the interface among materials D1n=D2n Mixtures Scattering?
Proposed Methodology Effects on Physiological Parameters (e.g. Vm, ISI) EM Field Source Membrane Model Internal EM Field Effects on single channel currents Single Ionic Channel Model Microscopic EM Field Effects on ion binding probability Ligand Ion Receptor Site Model Local Microscopic EM Field
Non thermal (Blackman, 1982) Effect of an EM field (147 MHz), sinusoidally amplitude modulated, on 45Ca2+ fluxes in chick brain embrio. (*: p<0.05; **: p<0.01)
Bioem interaction Besides the experimental evidence, scattered in the scientific literature, of the biological effects of low-intensity electromagnetic exposure, there is a lack of both understanding and consensus about the underlying interaction mechanisms. Therefore, there are no well established guidelines for identifying all the important variables to be kept under control during the experiments, for designing the optimal experimental conditions, for fitting theories to experimental data, for predicting, on a theoretical ground, the bioeffects and the exposure conditions to be experimentally tested. In attempting to elucidate the mechanisms, most researchers have concentrated their experimental and theoretical efforts on the early steps of the electromagnetic interaction, at molecular level. Chiabrera et al., 1999
more than 140 articles reviewed • around 15 journals involved • around 40 main authors Attemping to organize….. History ‘70s 2002
More recent papers at higher levels, new tecniques Attention to network of cells Direct E-B action: First papers followed “classical” models. All recent papers moved to quantistic ones
physiological EM field source Neuronal Network model Effects??? Membrane voltage Membrane model Internal EM field exposed biological system Channel currents Single Channel Model EM field on microscopic structure Binding probability Ligand Ion Receptor Site local EM field on microscopic structure Apollonio et al., 2000
Whole Membrane Model Transmembrane Voltage time (ms)
Effects on single channel currents Single Ionic Channel Model Ion binding model Pb Ligand dependent channel Effects on ion binding probability Fbm Ligand Ion Receptor Site Model Fbm(Vm) NEURONAL Model Local Microscopic EM Field METHODOLOGY
Binding Sites Calmodulin S-K Channel The S-K Channel Single Channel Model: Ligand-Dependent Channels Need of integration with more microscopic level An example: The Small Conductance Potassium Channel (Calcium controlled)
Molecular Simulations Protoporphirin IX Hemoglobin
Binding Sites Calmodulin S-K Channel The S-K Channel Single Channel Model: Ligand-Dependent Channels Need of integration with more microscopic level An example: The Small Conductance Potassium Channel (Calcium controlled)
[Ca2+ ] Popen Ca2+ -CaM Zeeman-Stark model SK channel model T D K+ DK- binding probability SAR=0.8 W/kg SAR=0.2 W/kg SAR=0.05 W/kg time (psec) First Step EM field
Single Ionic Channel 10ms 0
4 qji 0 3 CA* CA 2 qij 1 CA2 CA*2 closed open FINITE STATE MARKOV MODEL • The model is defined by N states, and it is characterised by: • Pi(t) occupation probability of state i • qij(t) transition coefficents from states i to j • The system evolves in time following the markovian equation: • dP(t) / dt = P(t) Q(t) • In the protein channel model: • each state corresponds to the channel open or closed • transition coefficents are affected by the exogenous e.m. field
Model cascade [Ca2+ ] Ca2+ -CaM Zeeman-Stark model Popen SK channel model T D K+ DK- EM field
[Ca2+ ] Popen Ca2+ -CaM Zeeman-Stark model SK channel model T D K+ DK- %effect binding probability SAR=0.8 W/kg SAR=0.8 W/kg SAR=0.2 W/kg SAR=0.05 W/kg intracellular Ca2+ [mM] time (psec) Second Step EM field
Single Channel Model: Voltage-Dependent Channels 100 ms
physiological EM field source Neuronal Network model Membrane voltage Membrane model Channel currents Single Channel Model Binding probability Ligand Ion Receptor Site local EM field on microscopic structure Apollonio et al., 2000
Membrane potential T0 = ISI Vm
OUTSIDE I I I I I I I I Na KC P Ca Ka KK PM B M Whole Membrane Model: Neuron Basic Model (D’Inzeo et al., 1994) INSIDE HH like Model
Whole Membrane Model: Analytical Representation