Thursday Afternoon Model Runs for Flatfish Assessments and Parameter Estimations
40 likes | 166 Views
This document outlines the methodology and results of Thursday afternoon runs, utilizing the base model "WedBase". Key modifications include the removal of recapture CPUE data and a two-step reweighting process. Several iterations, labeled Th2 through Th5, explore the effects of fixing mortality rates and adjusting age data. Models Th3A, Th3B, and Th3C feature varied parameters for catchability, mortality, and depletion estimates, while Th4 resets the starting year to 1970. The analysis aims to improve understanding of flatfish population dynamics.

Thursday Afternoon Model Runs for Flatfish Assessments and Parameter Estimations
E N D
Presentation Transcript
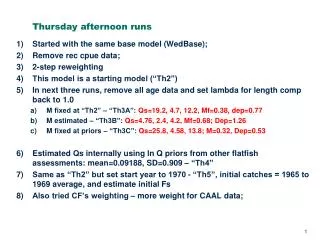
Thursday afternoon runs • Started with the same base model (WedBase); • Remove rec cpue data; • 2-step reweighting • This model is a starting model (“Th2”) • In next three runs, remove all age data and set lambda for length comp back to 1.0 • M fixed at “Th2” – “Th3A”: Qs=19.2, 4.7, 12.2, Mf=0.38, dep=0.77 • M estimated – “Th3B”: Qs=4.76, 2.4, 4.2, Mf=0.68; Dep=1.26 • M fixed at priors – “Th3C”: Qs=25.8, 4.58, 13.8; M=0.32, Dep=0.53 • Estimated Qs internally using ln Q priors from other flatfish assessments: mean=0.09188, SD=0.909 – “Th4” • Same as “Th2” but set start year to 1970 - “Th5”, initial catches = 1965 to 1969 average, and estimate initial Fs • Also tried CF’s weighting – more weight for CAAL data;
Th2: Th3A: Th3B: Th3C: Th4: Thursday afternoon runs
Th2: Th3A: Th3B: Th3C: Th4: Thursday afternoon runs
Th2: Th5: Thursday afternoon runs