Understanding the Production Possibility Frontier (PPF) in Macroeconomics
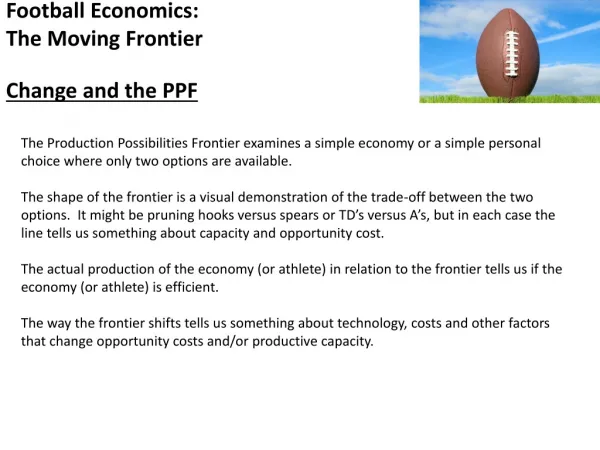
The Production Possibility Frontier (PPF) illustrates the most efficient production of goods and services in an economy, indicating the optimal allocation of resources. It shows the trade-offs between two goods (e.g., corn and cotton), where points on the curve reflect maximum efficiency while points inside indicate inefficiency. The PPF can shift due to changes in technology or inputs, signaling economic growth or contraction. For effective resource management, economies must decide how best to achieve efficiency while navigating the constraints imposed by scarcity.


Understanding the Production Possibility Frontier (PPF) in Macroeconomics
E N D
Presentation Transcript
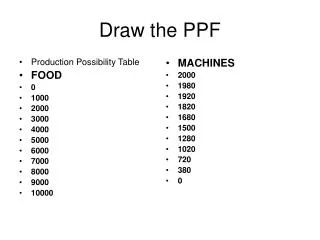
A. Production Possibility Frontier (PPF)Under the field of macroeconomics, the production possibility frontier (PPF) represents the point at which an economy is most efficiently producing its goods and services and, therefore, allocating its resources in the best way possible. If the economy is not producing the quantities indicated by the PPF, resources are being managed inefficiently and the production of society will dwindle. The production possibility frontier shows there are limits to production, so an economy, to achieve efficiency, must decide what combination of goods and services can be produced.
PPF • Definition of 'Production Possibility Frontier - PPF' • A curve depicting all maximum output possibilities for two or more goods given a set of inputs (resources, labor, etc.). The PPF assumes that all inputs are used efficiently
As indicated on the chart, points A, B and C represent the points at which production of Good A and Good B is most efficient. Point X demonstrates the point at which resources are not being used efficiently in the production of both goods; point Y demonstrates an output that the economy cannot attain at its present level of resources
Imagine an economy that can produce only Corn (A) and cotton (B). According to the PPF, points A, B and C - all appearing on the curve - represent the most efficient use of resources by the economy. Point X represents an inefficient use of resources, while point Y represents the goals that the economy cannot attain with its present level of resources.
As we can see, in order for this economy to produce more corn it must give up some of the resources it uses to produce cotton (point A). If the economy starts producing more cotton (represented by points B and C), it would have to divert resources from making corn and, consequently, it will produce less corn than it is producing at point A. As the chart shows, by moving production from point A to B, the economy must decrease corn production by a small amount in comparison to the increase in cotton output. However, if the economy moves from point B to C, corn output will be significantly reduced while the increase in cotton will be quite small. Keep in mind that A, B, and C all represent the most efficient allocation of resources for the economy; the nation must decide how to achieve the PPF and which combination to use. If more corn is in demand, the cost of increasing its output is proportional to the cost of decreasing cotton production.
Point X means that the country's resources are not being used efficiently or, more specifically, that the country is not producing enough cotton or corn given the potential of its resources. Point Y, as we mentioned above, represents an output level that is currently unreachable by this economy. However, if there was a change in technology while the level of land, labor and capital remained the same, the time required to pick cotton and corn would be reduced. Output would increase, and the PPF would be pushed outwards. A new curve, on which Y would appear, would represent the new efficient allocation of resources
When the PPF shifts outwards, we know there is growth in an economy. Alternatively, when the PPF shifts inwards it indicates that the economy is shrinking as a result of a decline in its most efficient allocation of resources and optimal production capability. A shrinking economy could be a result of a decrease in supplies or a deficiency in technology.
An economy can be producing on the PPF curve only in theory. In reality, economies constantly struggle to reach an optimal production capacity. And because scarcity forces an economy to forgo one choice for another, the slope of the PPF will always be negative; if production of product A increases then production of product B will have to decrease accordingly.