Download
1 / 52
530 likes | 820 Views
Biodiversity and Invasion. The Resilient Lives of Plants In the Arid Southwest. Tomoe Natori GIS Laboratory Dine College, Shiprock. What Is Biodiversity? American Heritage Dictionary Definition. bio- Life; living organism. <Greek. bios, life. diverse

E N D
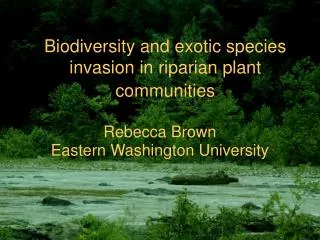
Biodiversity and Invasion The Resilient Lives of Plants In the Arid Southwest Tomoe Natori GIS Laboratory Dine College, Shiprock
What Is Biodiversity?American Heritage Dictionary Definition • bio- Life; living organism. <Greek. bios, life. • diverse Distinct in kind; unlike. Having variety in form; diversified. • -ty Condition; quality <Lat. –tas. Riparian Cottonwood Community Bosque del Alamos
What is biodiversity?in the real world Biodiversity is multi-conceptual It can be considered as: • Evolutionary Radiation
What is biodiversity?in the real world Biodiversity is multi-conceptual It can be thought of: Globally and collectively
Currently described species are on the order of 1.4 million. Current estimates of the total number of species run from 10-100 million. Some places are known better than other places.
What is biodiversity?in the real world Biodiversity is multi-conceptual It can be thought or looked as: • Characteristics of natural communities
Plants of the Desert Community Shadscale (Atriplex confertifolia) Community
Goosefoot Family (Chenopodiaceae) Shadscale (Atriplex confertifolia)
Goosefoot Family (Chenopodiaceae) Winterfat (Eurotia lanata)
Lily Family (Liliaceae) Mariposa Lily (Calochortus sp.)
Grass Family (Poaceae) Saltgrass (Distichlis spicata)
Grass Family (Poaceae) Indian Ricegrass (Stipa hymenoides)
Waterleaf Family (Hydrophyllaceae) Scorpionweed (Phaclia crenulata)
Sunflower Family (Asteraceae) Blanket Flower (Gaillardia pulchella)
Grass Family (Poaceae) Purple Three-awn Grass (Aristida purpurea)
Grass Family (Poaceae) Cheatgrass (Bromus tectrum)
Goosefoot Family (Chenopodiaceae) Russian Thistle (Salsola spp.)
Plantain Family (Plantaginaceae) Woolly Plantain (Plantago patagonica)
Plants of the Riparian Community Cottonwood (Populus fremontii) Community
Fremont Cottonwood(Populus fremontii)Willow Family(Salicaceae)
Olive Family (Oleaceae) New Mexico Olive (Forestiera neomexicana)
Cashew Family (Anacardiaceae) Three-leaf Sumac (Rhus aromatica)
Sunflower Family (Asteraceae) Rabbitbrush (Chrysothamnus nauseosus)
Goosefoot Family (Chenopodiaceae)Fourwing Saltbush (Atriplex canescens)
Goosefoot Family (Chenopodiaceae) Greasewood (Sarcobatus vermiculatus)
Family Tamaricaceae Saltcedar (Tamarix ramossisima)
Olive Family Elaeagnaceae Russian-olive Elaeagnus angustifolia L.
Grass Family (Poaceae) Indian Ricegrass (Stipa hymenoides)
Goosefoot Family (Chenopodiaceae) Russian Thistle (Salsola spp.)
Grass Family (Poaceae) Western Wheatgrass (Agropyron smithii)
Grass Family (Poaceae) Cheatgrass (Bromus tectrum)
Grass Family (Poaceae) Saltgrass (Distichlis spicata)
Hypothesis The presence of the nonnative species such as tamarisks and Russian Olive, has resulted in an overall reduction of the growth of native plants and trees with diverse biological life, whit this natural growth supports. • Sounds reasonable. But how do we measure it?
Predicting outcomes from the Hypothesis on Biodiversity If we found nonnative species-richness to be high in our study plots, and if these plots had less native species than other plots that didn’t have the nonnative species, then there is a possibility that nonnative species are decreasing the native plant species richness.
How do we measure Biodiversity? • Species diversity using multi-scale sampling technique species-(log)area curves • Regional diversity using geographic information system incorporate the data from the
Sampling and AnalyzingSpecies Diversity • Choosing the sites randomly from two different ecosystems (riparian vs. non-riparian) • Aerial photography • Random x and y coordinates along a line or curve • Scouting for accessibility • Using a current sampling methodology that allows analyses comparable to the regional data in future • Modified-Whittaker plot • Identifying the plant species found in all plots
Site Selection from Aerial Photo A total of ten plots were selected from this photo
Multiple-scale sampling technique Modified-Whittaker plot was developed to: Standardize vegetation sampling method Systemize vegetation patterns in spatial scales at 1m2, 10m2, 100m2, and 1000m2
Modified Whittaker Plot One 50m x 20m plot (K) Two 5m x 2m subplots (A and B) One 20m x 5m subplot (C) Ten 0.5m x 2m subplots (1-10)
Using Modified-Whittaker Plot All plant species in subplot 1-10 were recorded and the coverage by each was estimated All plant species in subplot A, B, and C were recorded All plant species in plot K were recorded Species not identified in the field were collected Four soil samples were collected from each plot
Work remained: • Analyses of native vs. exotic for larger plots • Species-area curve analysis of all plots • Data management of the results in GIS software
Species-Area Curve A cumulative number of species encountered as a function of area Log function is often used to correct the values of species richness and sampled areas
Lessons for future: • More intense study in published literature in the field of environmental ecology is necessary. • Appropriate ecological/mathematical models need to be identified and utilized. • More survey (and more time) is required to visualize highly complex patterns of vegetation. • Study sites should be selected in a protected areas with less disturbances.
Acknowledgement: Cassandra Begay Gregory Nells Shawna Sandoval Cheryl Walter Roberta Walter GIS Student Interns • Tonia Clark • Maxine Walter • Dr. Douglas Isely • GIS lab, Dine College