Download

1 / 31
310 likes | 459 Views
Industry Clusters and Inner City Economic Revitalization. National Governors’ Association Atlanta, Georgia June 6-7, 2002. Alen Amirkhanian VP, Research and Strategy Initiative for a Competitive Inner City (ICIC). Contents .

E N D
Industry Clusters and Inner City Economic Revitalization National Governors’ Association Atlanta, Georgia June 6-7, 2002 Alen Amirkhanian VP, Research and Strategy Initiative for a Competitive Inner City (ICIC)
Contents • The role of clusters in comprehensive inner city economic development strategy • Examples of inner city cluster-led strategies • Recommendations for State government action
Initiative for a Competitive Inner City ICIC Mission: Transform thinking, reinvigorate market forces, and engage the private sector in fostering healthy economies in America’s inner cities that create jobs, income, and wealth opportunities for inner-city residents. • Seven years of pioneering research on inner-city business growth opportunities, including the ICIC/Inc. Magazine Inner City 100 • Advisory services to many cities through the City Advisory Practice • Program to engage 350 urban business schools • Affiliates in 3 cities to catalyze on-the-ground private sector activity • Private equity fund (Inner City Ventures)
Defining Inner City St. Louis East St. Louis ILLINOIS MISSOURI • Poverty at least 1.5 times MSA poverty • MHI at least half of MSA MHI • Unemployment at least 1.5 times MSA unemployment • Or • Poverty > 20% • And • Exclude Central Business Districts (CBDs)
Housing Business & Wealth Healthy Inner-City Communities Health Education The business agenda is a complementary part of the building economically healthy inner cities
A Sustainable Model for Inner-City Business Development 1) A strategy based on competitive advantages and genuine business opportunities 2) A shift from a focus on community deficiencies (subsidies) to market opportunities (investment) 3) A comprehensive strategy for inner city business growth focused on private sector engagement 4) A framework that links the inner city economy to regional business clusters Objective: widen prosperity to all of our citizens
Strategies will not be ... They will be about ... Place and people Place vs. people Retention and attraction Retention vs. attraction Government vs. business Government and business What is our Intended Outcome? • Critical mass of initiatives and improvements that will: • a) Position the inner city to compete for jobs and investment within the regional economy • b) Make inner cities a better place in which to live and work • c) Increase job, income, and wealth opportunities of inner-city residents Thinking about inner city economic growth in this way avoids misguided debates
Inner City Competitive Advantages Strategic location • Located near regional transportation and telecommunications infrastructure nodes Underutilized Workforce Underserved local market • Largest pool of available workers in the US amid a tight labor market • $85 billion of annual retail spending power • 540 thousand businesses with more than $80 billion in commercial services demand Inner-city Linkage to industrial/regional clusters • Opportunity to leverage proximity to regional and industrial clusters
Inner City 100 Companies Build on Competitive Advantages • Vital Statistics: 2002 Winners • Average five year growth rate 1996-2000: • Average sales in 2000: • Average hourly wage: • Percent minority-owned: • Percent living in the inner city: 20% of senior management29% of Midlevel/skilled employees50% of Rank & File employees Total IC 100 539% $19.0 M $12.44 33% 44% Employment among the Inner City 100 doubled between 1996 and 2000, creating 7,984 jobs
Business Development Strategy: Alternative Growth Strategies for Inner-City Neighborhoods Growth Trajectory (Employment, revenue, wages, and utilized real estate) Cluster strategy, Underutilized assets, business environment, ... Small-businesses strategy Microenterprise strategy No-growth strategy Today Time
Developing an Inner City Business Development Strategy Understand the business base & quality of business environment Create a leadership group for action Institutionalize efforts in the public and private sectors Identify market opportunities and underutilized assets Address Barriers to Competitiveness and Growth
A comprehensive view of inner city business and wealth growth Components of Inner City Economic Growth Strategy Bus. Environ. Improvements Cluster-led Strategies Positive Image Strategies Wealth Creation Strategies • Linking inner-city assets with regional cluster and growth opportunities; • Harnessing agglomoration economies • For local services clusters, reversing outmigration Addressing cross-cutting issues that impact company competitiveness regardless of cluster • Facilitating employer-assisted asset-building; • Encouraging savings; • Homeownrshp • Media coverage of inner city businesses that are succeeding • Inner City 100
Traded Clusters Local “Clusters” Natural Resource Clusters • Export products beyond their region--driving economies • Higher than average concentration of inter-related industries • Examples: Automotive, Footwear, Wine • 36% of US employment • $41,678 Avg. wage • Serve local demand • No higher than average concentration--similar business prevalent in most localities • Examples: Local Personal Services, Local Retail, Local Construction • 64% of US employment • $26,049 Avg. wage • Natural Resource-Driven industries are location-specific industries that depend upon the availability of scare resources. • Examples: Mining, oil & natural gas exploration, forestry • 0.8% US employment • $31,264 Avg. wage Defining Clusters and Explaining Regional Economies • A cluster is a geographically proximate group of interconnected companies and associated institutions in a particular field, including producers, service providers, suppliers, and universities. • Clusters arise out of the linkages or externalities that span across industries in a particular location. • Clusters are both a descriptive tool and a prescriptive tool.
A comprehensive view of inner city business and wealth growth Components of Inner City Economic Growth Strategy Bus. Environ. Improvements Cluster-led Strategies Positive Image Strategies Wealth Creation Strategies Traded Local • Growth opportunities • Supplier relationships • Cooperative activities • Specialized business resources • Entrepreneurship • Cross-cutting business environment issues • Everything in traded and more • Local unmet demand • Population growth
St. Louis MSA Business Base Percent of Employment/Revenue 1999 Profile City Total Inner City St. Louis City (21%) MSA1 85,600 1,325 $157.8 13,099 15.3% 280 21% $34.4 22% 7,854 9.2% 60% 168 13% 60% $21.2 13% 62% Establishments Share of MSA (%) Share of City(%) Employment2 (K) Share of MSA (%) Share of City (%) Est. revenues (B) Share of MSA (%) Share of City (%) St. Louis Inner City (13%) Remainder of MSA (79%) Inner-City St. Louis represents 60% of the City’s employment and revenue Notes:(1) The St. Louis MSA includes St. Louis City, St Louis, St. Charles, Franklin, Jefferson, Warren, Lincoln, Madison-IL, St. Clair-IL , Monroe-IL, Clinton-IL, and Jersey-IL. (2) The employment estimates exclude public-sector jobs including the US Postal Service. Source: 1999 ABI data; 1999 St. Louis Business Journal Book of Lists; ICIC analysis.
Approx 1,000 estab. St. Louis Inner-City Clusters (1999) Inner-City Share of MSA Employment in the Cluster (%) 70% Beverages 55% Chemical Products Medical Sciences 30% Communications & Utilities 25% Education & Knowledge Creation Transportation & Logistics 20% Commercial Services Personal Services 15% Tourism & Entertainment Financial Services 10% Metal Mfg. Construction Services & Materials Retail 5% Professional Services 0% 21% 0% 5% 10% 15% Cluster Share of Total Inner-City Employment** (%) Notes: (*) Retail, Commercial Services, Personal Services, and Professional Services are not included in Harvard Cluster Mapping Project. (***) Percentages will not total 100 due to overlapping of industries among clusters.
Economic engines High growth potential Less vulnerable to business cycles Derive competitive advantages from IC location Job opportunities that match skills Entrepreneurial potential Quality of jobs Cluster Prioritization Criteria • Ultimately all clusters must be analyzed. Economic Development professionals should not be picking winners. • But as a first step, given limited resources focus clusters can be selected that offer the most immediate opportunities for inner-city job and business growth Economic Performance Inner-City Fit
Average Annual Employment Change* (1993-1998) St. Louis Inner City and MSA 12.5% % Change in Inner-City Employment (Total Average +1.1%) % Change in MSA Employment (Total Average +2.1%) Note: (*) Changes reflect data for core industries within each cluster. Source: Missouri Department of Economic Development; Michael E. Porter Cluster Mapping Project; ICIC analysis.
St. Louis Inner-City Clusters (1999) Approx 1,000 estab. Inner-City Share of MSA Employment in the Cluster (%) 70% Beverages 55% Chemical Products Medical Sciences 30% Communications & Utilities 25% Education & Knowledge Creation Transportation & Logistics 20% Commercial Services FOCUS CLUSTERS Personal Services 15% Tourism & Entertainment Financial Services 10% Metal Mfg. Construction Services & Materials Retail 5% Professional Services 0% 21% 0% 5% 10% 15% Cluster Share of Total Inner-City Employment** (%) Notes: (*) Retail, Commercial Services, Personal Services, and Professional Services are not included in Harvard Cluster Mapping Project. (***) Percentages will not total 100 due to overlapping of industries among clusters.
Case Studies • Case 1: Bridgeport META (cluster upgrading) • Case 2: St. Louis Construction (cluster-led workforce training)
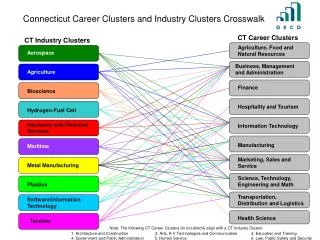
Metal Manufacturing Is Bridgeport, CT’s Most Prominent Cluster Cluster’s Share of Total City Revenue* (%) Metal Manufacturing Medical Devices & Health Services Financial Services Construction Entertainment & Tourism Pharmaceuticals Office Services Retail Services** Transportation & Logistics ~500estab. Commercial Services** Plastics Info. Technology Social Services Cluster’s Share of Total City Employment* (%)
Bridgeport, CT’s Metal Manufacturing Cluster Was Not Performing Up to National Standards Despite national growth in metal manufacturing, Bridgeport’s metal manufacturing cluster remained stagnant from 94-99 Threat • Bridgeport will lose an essential part of its economic base if metal manufacturers do not adapt to the new market • Potential to retain existing companies and jobs and build on this strong manufacturing base. Opportunity KEY CHALLENGE: How can Bridgeport’s metal manufacturers become more competitive and share in national growth?
Bridgeport Formed the Metal Manufacturing Education & Training Association To Increase Firm Competitiveness METAL Marketing Purchasing Workforce Development Lean Manufacturing Utilities Benefits & Insurance Cutting Supplies Waste Transportation Expert-Led Workshops Shared Learning Technology/ Automation Joint Business Opportunities Shared Marketing Costs Cluster-Specific Skills Training Job Placement Apprenticeships
Bridgeport METAL: Progress • 11 companies, 1579 employees, over $235 million in annual sales • Secured over $2 million dollars in funding • Companies continue to invest time (over 1,500 hours to date) and money (over $160,000) notwithstanding the deep recession in manufacturing. • Facilitated the transfer of “best practices” across company lines • Increased the willingness of small manufactures to collaborate with government to improve competitiveness Overall • Completed a needs assessment and gap analysis of the workforce • Conducted 34 customized training classes for 400 employees • Training has resulted in a 53% increase in proficiency overall, • Companies also noted immediate benefits in morale and motivation. • METAL has been a catalyst for institutional change -Housatonic Community College (HCC), • Training is helping employees retain their jobs Workforce Development Lean Manufacturing • Conducted over 30 kaizen/training events at 7 companies • Lean Program has (1) reduced work in process by 50%, (2) reduced set-up times on machines by 50%, (3) reduced floor space for shipping and receiving by 20%-25%, and (4) reduced parts travel distances by 25% • Developed a Lean Expert Certification Program
Case Studies • Case 1: Bridgeport META (cluster upgrading) • Case 2: St. Louis Construction (cluster-led workforce training)
St. Louis Construction Labor Supply Gap • Construction jobs pay up to $24 per hour plus benefits, and do not require advanced education. • Existing union membership is projected to decline over the next several years due to retirement and a relatively small number of apprentices (approximately 3,000). • With training, there will be significant opportunity for inner-city residents to step into these positions. Total Construction Jobs Year Construction Labor Gap 2,695 3,383 4,562 6,563 9,279 Source: 1999 F.W. Dodge; Missouri Depart of Transportation; ICIC analysis. Increase number of inner-city and minority workers in the construction trades Recommendation
St. Louis Construction Unions & Industry Are Working Together To Address This Issue • Progress to date: • Working on the standardization of apprenticeship application processes across trades • Information outreach on construction career opportunities to inner city schools and community centers in 2000 • PRIDE, a consortium of unions, contractors and others, has funded a $10,000 project to better understand barriers to minorities entering the construction field. (Completed in Nov 2001) • Currently pushing for a city ordinance that will strongly encourage the use of apprentices on public works projects, and public/private partnerships Implementation vehicle: Chair of working group: Craig Schnuck, CEO, Schnuck Markets Members of working group: • Head of St. Louis Unions • CEOs of two major construction firms • East-West Gateway Coordinating Council
From Opportunity to Action Identify Implementation Vehicle Identify Opportunity Make Recommendations Drive to Action • Weak link to strong tourism cluster • Underperforming vs. other metro zoos • Develop plan to turn zoo into major urban attraction • Zoo task force • Mayor’s office • Creation of eco-tourism destination • Attendance doubled and revenues tripled Boston Zoo • Industry-designed training • Public/private partnership with local community college • Over 90% of graduates placed • Labor shortage due to aging workforce • 800-1000 jobs opening Chicago Railroads • Capitalize on St. Louis metal manufacturing by • Marketing of regional strength • Joint marketing by companies in city • Public/private partnership b/w state, local technical college, private and non-profit representatives • Exceptionally high-quality metal manufacturer’s which were lagging national trends in sales and employment • Marketing program with 3-year timeline developed • Launch contingent on funding from state or other source St. Louis Metal Mfg
Recommendations for State Economic Development Policy • Overall • Make inner city business and job competitiveness and growth a key component of regional economic development strategies that the State government supports • Make cluster-led growth strategies a critical part of inner city economic growth strategies adopted by regions and localities -- inner cities have assets; inner cities will grow by linking to growth • Ensure economic development strategies focus on other factors key to business and job growth: business environment improvements, positive image strategies, and wealth creation strategies.
Recommendations for State Economic Development Policy • Overall • Invest in improved economic intelligence -- map clusters, benchmark performance • Encourage private-sector leadership in devising and implementing cluster-based networks or collaborative efforts -- both within the inner city and regionally • Encourage partnerships between local academic institutions, governments, community groups and business to spur cluster growth • Prioritize investment in cross-cutting business environment issues that arise from cluster working groups -- workforce, infrastructure, capital, marketing, etc. • Market inner city success -- inner city success stories are critical battling misperception